Technical Analysis for Stock Market Beginners
1. What Is Technical Analysis? A Simple Explanation
Technical analysis is a way of studying a stock by looking at its price chart, trading volume, and repeated behavior patterns. Instead of beginning with a company's earnings, products, management, or valuation, technical analysis begins with a simpler question: what has the price been doing, and how are buyers and sellers behaving right now?
For a complete beginner, think of it like reading footprints. A chart does not tell you the future. It shows where investors and traders have already placed their money. When many buyers step in near the same price again and again, that area may become support. When sellers keep appearing near a higher price, that area may become resistance. When price keeps making higher highs and higher lows, beginners call that an uptrend. When it keeps making lower highs and lower lows, it may be a downtrend.
The honest way to use technical analysis is not to say, “This pattern guarantees the stock will go up.” A better way is: “This chart gives me a possible scenario. If the price behaves as expected, I may take action. If it does not, I will protect my capital.” That difference matters. Beginners who treat charts as a prediction machine often overtrade. Beginners who treat charts as a planning tool usually make calmer decisions.
1.1 How Technical Analysis Works
Technical analysis works because market prices are created by people placing buy and sell orders. Those people include long-term investors, short-term traders, institutions, hedge funds, algorithms, news-driven buyers, emotional sellers, and beginners reacting to headlines. All of those decisions show up in price and volume.
A technical analyst studies three practical things. First, direction: is the stock trending up, trending down, or moving sideways? Second, location: is the current price near an area where buying or selling previously appeared? Third, timing: is there a clear reason to enter now, wait, or avoid the trade?
The method is based on probability, not certainty. A clean chart setup can fail because of earnings news, interest-rate changes, market panic, a company-specific problem, or simple randomness. That is why serious traders combine technical analysis with risk management. The chart may suggest an entry, but the risk plan decides whether the trade is worth taking.
2. Why Beginners Like Technical Analysis
Beginners are often attracted to technical analysis because charts feel visual and immediate. You do not need to read a full annual report before you can understand that a stock is rising, falling, or stuck in a range. A chart can also help a beginner avoid buying only because a stock is popular on social media.
For example, a new investor may hear that a stock is “hot” and want to buy immediately. A chart may show that the price has already jumped sharply for several days and is now far above its usual moving average. That does not prove the stock will fall, but it warns the beginner that the easy part of the move may already be over. In that situation, technical analysis can slow the decision down.
Another reason beginners like it is that it encourages rules. Instead of saying, “I will buy because I feel good about this company,” a beginner can say, “I will only buy if the price breaks above resistance with strong volume, and I will exit if it falls below my stop level.” Rules do not remove risk, but they reduce emotional guessing.
3. Technical Analysis vs. Fundamental Analysis
Technical analysis and fundamental analysis answer different questions. Fundamental analysis asks, “What is this business worth?” Technical analysis asks, “What is the market doing with the price right now?” A long-term investor may care more about revenue growth, profit margins, debt, competition, and valuation. A short-term trader may care more about trend, momentum, support, resistance, and volume.
Beginners should not think they must choose only one. Many experienced market participants use both. For example, a person may use fundamental analysis to build a watchlist of financially strong companies and technical analysis to decide whether the chart offers a reasonable entry. This is often more practical than buying a good company at any price.
The key comparison is simple: fundamentals can help you decide what to buy; technical analysis can help you decide when the price action looks favorable. Neither method is perfect. A great company can have a falling stock price for months. A weak company can rise quickly during a speculative trend. The best beginner habit is to respect both price action and business reality.
3.1 Quick Comparison: Technical vs. Fundamental Analysis
| Question | Technical analysis | Fundamental analysis |
|---|---|---|
| Main focus | Price, volume, trends, chart patterns and indicators | Earnings, revenue, debt, valuation, industry and management |
| Best used for | Timing entries, exits, risk levels and market behavior | Understanding business quality and long-term value |
| Beginner risk | Seeing patterns that are not really meaningful | Ignoring price weakness because the business sounds good |
| Practical combination | Use charts to plan risk and timing | Use fundamentals to choose stronger watchlist candidates |
4. The Chart Basics Every Beginner Should Know
A stock chart is simply a visual record of price over time. The horizontal axis shows time. The vertical axis shows price. A daily chart means each candle or bar represents one trading day. A weekly chart means each candle represents one week. Beginners often make better decisions when they start with daily and weekly charts before looking at very short time frames.
The most common chart type is the candlestick chart. A candle shows the open, high, low, and close for a period. If the stock closes higher than it opened, many platforms show a positive candle. If it closes lower, they show a negative candle. The body of the candle shows the distance between open and close, while the wick shows the high and low.
Do not overcomplicate candles in the beginning. Your first goal is not to memorize every candlestick pattern. Your first goal is to understand whether buyers or sellers are in control. Long strong candles in the direction of the trend may show momentum. Repeated failed attempts near the same price may show resistance. Big price moves on unusually high volume may show that larger market participants are involved.
4.1 Trends: The First Thing to Identify
Before using indicators, beginners should identify the trend. A stock in an uptrend usually makes higher highs and higher lows. A stock in a downtrend usually makes lower highs and lower lows. A sideways market moves between a support area and a resistance area without clear direction.
Why does this matter? Because many beginner losses come from fighting the trend. Buying a stock only because it has fallen a lot can be dangerous if the downtrend is still active. Selling too early just because a stock has risen can also be a mistake if the uptrend remains healthy.
A practical beginner rule is: trade less when the trend is unclear. If the chart looks messy and you cannot explain the trend in one sentence, skip it. There are always more stocks and more days. Good technical analysis is partly about knowing when not to trade.
4.2 Support and Resistance in Plain Language
Support is an area where buyers have previously been strong enough to stop or slow a decline. Resistance is an area where sellers have previously been strong enough to stop or slow a rise. These are not exact magic lines. They are zones.
Imagine a stock falls to around $50 three times and rebounds each time. Beginners may mark $50 as support. If the price later falls below $50 with heavy volume, that support may have failed. On the other hand, if a stock rises to around $70 several times but cannot move above it, $70 may be resistance. If price later breaks above $70 and holds there, some traders may see that as a bullish breakout.
The practical value is planning. A beginner can use support to think about where a trade idea becomes wrong. A beginner can use resistance to think about where profit-taking pressure may appear. This is much healthier than buying randomly and hoping.
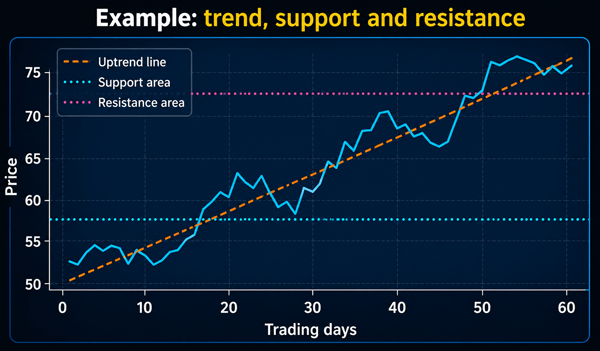
Figure 1: Trend, support and resistance example.
4.3 Volume: The Confirmation Tool Beginners Ignore
Volume shows how many shares traded during a period. Price tells you direction; volume gives clues about participation. A breakout above resistance on weak volume may fail because not enough buyers supported it. A breakout on strong volume may be more meaningful because more market participants joined the move.
A simple example: Stock A breaks above $100 after touching that level several times. If volume is average or lower than usual, the breakout may be less convincing. If volume is much higher than normal, it may show stronger demand. Still, volume is not a guarantee. It is one piece of evidence.
For beginners, volume is useful because it prevents blind trust in patterns. A chart pattern without volume support is like a statement without evidence. You may still watch it, but you should be more cautious.
4.4 Moving Averages: A Simple Way to See the Bigger Picture
A moving average smooths price data so beginners can see the general direction more clearly. A 50-day moving average shows the average closing price over the last 50 trading days. A 200-day moving average shows a much longer trend.
When price is above a rising moving average, the stock may be in a healthier trend. When price is below a falling moving average, the stock may be weak. Some traders watch crossovers, such as a shorter moving average moving above a longer one. But beginners should avoid treating crossovers as automatic buy or sell signals. Moving averages are often late because they are based on past prices.
The best beginner use is context. If a stock is far above its moving average, it may be extended. If it pulls back toward a rising moving average and finds support, some traders may watch for a lower-risk entry. If it breaks below an important moving average with heavy volume, the trend may be weakening.
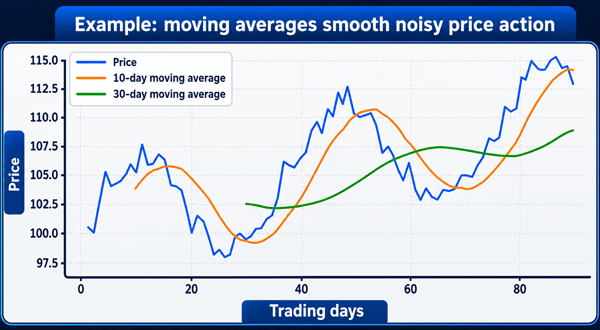
Figure 2: Moving averages example: Stock price chart with 10-day and 30-day moving averages smoothing price movement.
4.5 Beginner-Friendly Indicators and What They Actually Tell You
| Indicator | What it helps with | Beginner use | Common mistake |
|---|---|---|---|
| Moving average | Trend direction and smoother price context | Check whether price is above or below a rising/falling average | Using every crossover as a trade signal |
| RSI | Momentum and possible overbought/oversold conditions | Notice when momentum is stretched | Buying only because RSI is low |
| MACD | Momentum shifts and trend strength | Use as secondary confirmation | Entering late after the move is mostly finished |
| Volume | Participation behind a move | Confirm breakouts or breakdowns | Ignoring volume during major price moves |
| ATR | Average price movement and volatility | Plan realistic stops and position size | Using the same stop size for every stock |
5. A Practical Beginner Workflow: How to Use Technical Analysis Step by Step
Here is a simple workflow a beginner can actually follow. Start with a watchlist, not random stocks. Your watchlist can include large companies, ETFs, or stocks you already understand. Then open the weekly chart and ask: is the bigger trend up, down, or sideways? Next, open the daily chart and mark obvious support and resistance areas. Do not force lines everywhere. Mark only the levels that clearly stand out.
After that, look for a setup. A setup is a situation where price, trend, location, and risk come together. For example, price may pull back toward support in an uptrend, then show renewed buying volume. Or price may break above resistance after several failed attempts. The setup should be simple enough that you can describe it in one sentence.
Before entering, write down four numbers: entry price, stop-loss area, target area, and position size. If you cannot define where the idea is wrong, you do not have a trade plan. If the possible loss is too large, reduce position size or skip the trade. After the trade, keep a journal. Write what you saw, why you entered, what happened, and what you learned. This habit turns market experience into education.
5.1 Practical Example: Analyzing a Stock Like a Beginner
Suppose a stock has been rising from $80 to $100 over several weeks. It then pulls back to $92, where it previously found buyers. The 50-day moving average is also near $92. Volume decreases during the pullback, which may suggest selling pressure is not aggressive. A few days later, the stock rises from $92 to $96 on stronger volume.
A beginner could interpret this as a possible pullback setup in an uptrend. The entry might be near $96 after confirmation. The stop-loss could be below the support zone, perhaps around $90 or $91 depending on volatility. A target could be near the prior high around $100, or higher if the stock breaks out.
Now comes the honest part. This is not a guaranteed trade. The stock could fail at $100, fall below support, or react badly to news. The only reason this example is useful is because it creates a plan before money is at risk. Technical analysis is valuable when it helps you prepare for both the expected outcome and the wrong outcome.
5.2 Risk Management: The Part That Matters More Than Being Right
Most beginners focus on finding the perfect indicator. Experienced traders usually care more about risk. You can have many losing trades and still survive if each loss is small. You can also destroy an account with one oversized trade, even if your chart analysis looked good.
A simple risk rule is to risk only a small percentage of your trading capital on one idea. Many traders use 1% or less as a reference point, but each person's situation is different. The important idea is that the loss should be planned and emotionally manageable before the trade begins.
Risk-reward matters too. If you risk $5 per share to possibly make $10 per share, the potential reward is twice the risk. That does not make the trade good by itself, but it helps you avoid trades where the possible gain is too small compared with the possible loss. Beginners should also remember that a stop-loss is not perfect. In fast markets, prices can gap below a stop level.
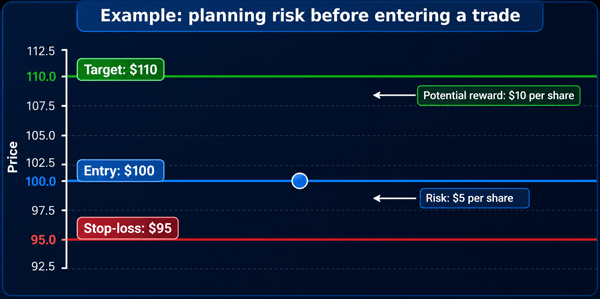
Figure 3: Risk-reward planning example: Price levels showing entry, stop-loss and target to explain risk-reward planning.
5.3 Beginner Checklist Before Placing a Trade
- Identify the market trend before choosing a setup.
- Mark support and resistance as zones, not exact magic lines.
- Use volume as confirmation, especially on breakouts.
- Avoid using too many indicators at once.
- Write down entry, stop, target and position size before entering.
- Never risk money needed for bills, emergency savings or debt payments.
- Review trades in a journal instead of blaming the market.
- Avoid social-media hype, guaranteed-profit claims and revenge trading.
6. Common Mistakes Beginners Make
The first mistake is believing that technical analysis predicts the future. It does not. It gives structured possibilities. The second mistake is changing time frames to feel better. A beginner may buy on a daily chart, then switch to a five-minute chart when the trade goes against them, then switch to a weekly chart to justify holding. Pick your time frame before entering.
The third mistake is indicator stacking. Adding RSI, MACD, Bollinger Bands, stochastic, moving averages, Fibonacci levels and several trendlines does not automatically improve the decision. It can create confusion. Beginners should start with price, volume, support, resistance and one or two indicators.
The fourth mistake is ignoring the broader market. A strong individual stock can struggle if the whole market is falling sharply. Before trading, check the major index trend. The fifth mistake is taking online screenshots too seriously. Many people share winning trades after the fact. Few show their full journal, position sizing, losing streaks or emotional pressure.
6.1 Helpful Tools Without Overbuying Expensive Products
A beginner does not need the most expensive trading software on day one. Many online brokerage account platforms include basic charts, watchlists, moving averages, volume, alerts and paper trading. Free charting tools can also be enough for learning.
Paid tools may be useful later if they save time or provide better screening, backtesting, alerts, or portfolio management features. But beginners should be careful with high-pressure stock trading course offers, signal groups, and “best trading platform” claims that sound too good to be true. The best platform is not the one with the loudest marketing. It is the one you understand, can use safely, and that supports your investment strategy without encouraging reckless trading.
Before paying for any tool, ask: Does this help me make clearer decisions, or does it just make me feel more active? Does it improve my risk management? Can I test it with paper trading first? Is the cost reasonable compared with my account size?
6.2 How to Practice Technical Analysis Safely
The safest way to begin is paper trading, chart replay, or small observation exercises. Choose five stocks or ETFs and follow them for a month. Each week, mark the trend, support, resistance, major moving averages and volume changes. Write what you think may happen next, then check the chart later. Do this without risking real money.
After some practice, review your notes. Did you chase stocks after big moves? Did you ignore failed breakouts? Did you see support and resistance more clearly over time? This is how people develop experience. Real skill comes less from memorizing patterns and more from seeing how often patterns fail, where they fail, and how disciplined traders protect themselves.
When real money is involved, start smaller than your ego wants. The goal is not to get rich quickly. The goal is to learn process, patience and risk control.
7. FAQs: Technical Analysis for Stock Market Beginners
7.1 Is technical analysis good for beginners?
Yes, if it is used as a learning and planning tool rather than a promise of profit. Beginners should start with trend, support, resistance, volume and risk management before using advanced indicators.
7.2 Can technical analysis make me rich quickly?
No reliable method can promise that. Short-term trading can lead to losses, especially for beginners. The better goal is to learn disciplined decision-making and capital protection.
7.3 Which indicator is best for beginners?
Moving averages and volume are usually easier to understand than complex indicators. RSI can also be useful, but no single indicator should be used alone.
7.4 Should I use technical analysis for long-term investing?
It can help with timing entries and avoiding emotionally extended prices, but long-term investors should also study fundamentals, diversification, fees, taxes and personal goals.
7.5 How much money do I need to start?
You can start learning with no money through paper trading and chart study. Real-money decisions should depend on your financial situation, emergency savings, debt, goals and risk tolerance.
7.6 What is the biggest technical analysis rule for beginners?
Always know where your idea is wrong before entering. If there is no exit plan, there is no complete plan.
8. Final Thoughts
Technical analysis is not a shortcut around learning. It is a language for understanding price behavior. Once beginners learn that language, charts become less mysterious. You can see when a stock is trending, when it is losing momentum, where buyers previously appeared, where sellers may appear, and where your trade idea becomes invalid.
The best beginner approach is simple: study clean charts, avoid hype, use fewer indicators, respect risk, keep a journal, and remember that being wrong is part of the process. Technical analysis becomes useful when it makes you more disciplined, not when it makes you more confident without evidence.
If you remember only one sentence, remember this: technical analysis should help you make a plan, manage risk and avoid emotional decisions - not convince you that the market owes you a profit.
Sources Consulted and Checked
The following sources were consulted and checked while preparing this article to support accuracy, reliability, and further reading.
- Investor.gov / SEC: Introduction to Investing and investor education materials. https://www.investor.gov/introduction-investing
- Investor.gov / SEC: Risk and return explanation for beginner investors. https://www.investor.gov/additional-resources/information/youth/teachers-classroom-resources/risk-and-return
- FINRA: Risk: investing basics. https://www.finra.org/investors/investing/investing-basics/risk
- Charles Schwab: Investing basics: technical analysis. https://www.schwab.com/learn/story/investing-basics-technical-analysis
- CFA Institute Research Foundation: Technical Analysis literature review. https://rpc.cfainstitute.org/sites/default/files/-/media/documents/book/rf-lit-review/2016/rflrv11n11.pdf
Reader Advice
This article is provided solely for educational and informational purposes. It does not constitute financial, investment, trading, tax, legal, or other professional advice, and it should not be treated as a recommendation to buy, sell, or hold any security or financial product. Technical analysis is based on historical price and volume information and cannot predict future market movements with certainty. Trading and investing involve risk, including the possible loss of principal. Before making any financial decision, readers should consider their personal circumstances, objectives, risk tolerance, and financial position, and seek advice from an appropriately qualified and licensed professional where necessary.
Market conditions, laws, regulations, tax rules, platform features, fees, and other facts or figures may change over time or differ by country, institution, and individual circumstances. Readers should therefore verify current information through official regulators, financial institutions, company filings, and other authoritative sources. Never risk money required for essential expenses, emergency savings, debt payments, or other important commitments.