Stock Market Candlestick Patterns Every Beginner Should Know
Candlestick patterns are one of the first things many new traders notice on a stock chart. They look simple: a little rectangle, a thin line above it, and another line below it. But behind that small shape is a story about buyers, sellers, confidence, fear, hesitation, and momentum.
The good news is that you do not need to be a Wall Street expert to understand candlesticks. A candlestick is just a visual summary of price movement during a chosen time period. It can represent one minute, one hour, one day, one week, or any other timeframe your chart allows. Once you understand what each candle is telling you, candlestick charts become much easier to read.
This guide explains stock market candlestick patterns in a clear, practical way for beginners. You will learn what candlesticks are, how they work, which patterns matter most, how traders actually use them, and what mistakes to avoid. The goal is not to make trading sound easy. The goal is to help you read charts more responsibly, with realistic expectations and better risk control.
1. What Is a Candlestick in the Stock Market?
A candlestick is a chart symbol that shows four prices for a specific period: the opening price, highest price, lowest price, and closing price. These are often called OHLC: open, high, low, and close.
- Open: the price where the stock started that candle period.
- High: the highest price reached during that period.
- Low: the lowest price reached during that period.
- Close: the final price at the end of that period.
The thick part of the candle is called the body. The thin lines above and below the body are called wicks or shadows. The body shows the distance between open and close. The wicks show how far price moved beyond the open and close before settling.
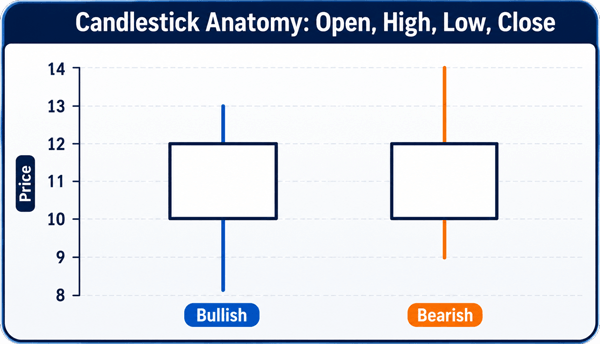
In most charting platforms, a green or white candle means the price closed higher than it opened. A red or black candle means the price closed lower than it opened. The exact colors may change depending on your stock analysis software or online brokerage account settings, but the idea is the same.
2. Why Do Candlestick Patterns Matter?
Candlestick patterns matter because they show price behavior in a way that is easy to scan. Instead of reading a long list of prices, you can quickly see whether buyers were strong, sellers were strong, or the market was unsure.
For example, a candle with a long lower wick tells you that sellers pushed the price down, but buyers stepped in and moved it back up before the candle closed. That does not guarantee the stock will rise next, but it tells you buyers defended a lower price area. That is useful information when combined with trend, volume, support, resistance, and broader market conditions.
Experienced traders usually do not treat candlestick patterns as magic signals. They use them as clues. A single candle is like one sentence in a bigger story. The trend, volume, market news, sector strength, and risk level are the rest of the paragraph.
3. How Candlestick Patterns Work in Real Life
Candlesticks work by compressing market behavior into a simple visual form. Imagine a stock opens at $50, falls to $48, then rallies and closes at $52. A beginner might only see that the stock went up $2. A candlestick reader sees more detail: sellers tried to push the stock lower, buyers rejected that lower price, and the stock closed strong.
That type of candle can be meaningful if it appears near a support level, after several days of selling, or with higher-than-normal volume. But the same candle may mean very little if it appears in the middle of a choppy range with no clear context.
This is the most important beginner lesson: candlestick patterns are not strong by themselves. They become more useful when the location makes sense.
4. The First Thing Beginners Should Learn: Trend Comes First
Before memorizing patterns, learn to ask one question: what is the current trend? Is price generally moving up, moving down, or moving sideways?
- In an uptrend, bullish continuation patterns may carry more weight than random bearish candles.
- In a downtrend, bearish continuation patterns may be more reliable than one hopeful green candle.
- In a sideways market, many patterns fail because neither buyers nor sellers have clear control.
A common beginner mistake is seeing a bullish pattern in a strong downtrend and assuming the stock must reverse. Sometimes it does. Often it does not. Trend is like the road direction; the candlestick is like a traffic signal. You need both to make sense of the situation.
5. Candlestick Pattern Categories Beginners Should Know
Most beginner-friendly candlestick patterns fall into three groups: reversal patterns, continuation patterns, and indecision patterns.
- Reversal patterns suggest the current move may be losing strength and price could turn.
- Continuation patterns suggest the current trend may continue after a pause.
- Indecision patterns show uncertainty, where neither buyers nor sellers are clearly winning.
The word "suggest" matters. A pattern does not promise anything. It only shows what happened during a candle or group of candles. Your job is to decide whether that behavior is meaningful enough to build a cautious trade plan around it.
6. Single-Candle Patterns Every Beginner Should Know
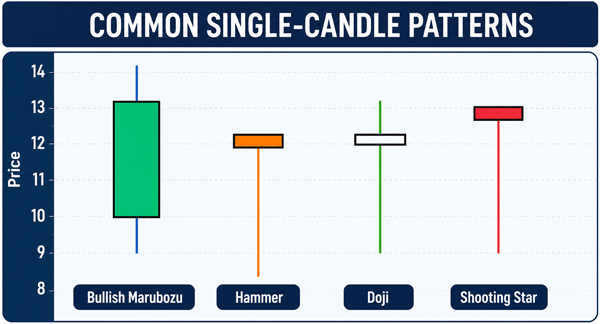
6.1 Doji: The Market Is Undecided
A doji forms when the open and close are very close to each other. It means price moved during the candle, but neither buyers nor sellers were able to finish with control. Beginners often describe it as a candle that looks like a cross or a plus sign.
A doji is not automatically bullish or bearish. Its meaning depends on where it appears. After a long rally, a doji may show buyers are getting tired. After a long sell-off, it may show sellers are losing pressure. In the middle of a random sideways chart, it may mean almost nothing.
Practical example: Suppose a stock has risen from $40 to $52 over two weeks. Then it forms a doji near a known resistance level at $53. That does not mean you should immediately short the stock. It means momentum may be slowing, so a beginner might wait for confirmation, such as the next candle closing lower, before making any decision.
6.2 Hammer: Buyers Defend a Lower Price
A hammer has a small body near the top of the candle and a long lower wick. It usually appears after a decline. The long lower wick shows sellers pushed the price down, but buyers brought it back up before the close.
A hammer can be a bullish reversal clue, but beginners should be careful. A hammer works better when it appears near support, after a clear downtrend, and with stronger volume. Without those conditions, it may simply be a temporary bounce.
Beginner use: Mark the low of the hammer as a risk level. If the next candles cannot stay above that low, the pattern may have failed. This makes the hammer useful not only for entry ideas, but also for planning where the idea becomes invalid.
6.3 Shooting Star: Sellers Reject a Higher Price
A shooting star has a small body near the bottom of the candle and a long upper wick. It usually appears after an advance. It shows buyers pushed price higher, but sellers rejected that higher level before the close.
A shooting star can warn that an uptrend is weakening, especially near resistance. However, it should not be used alone. Many strong stocks form upper wicks and continue higher. Confirmation matters.
Practical example: A stock rallies into a previous high at $80 and forms a shooting star with heavy volume. A beginner might not short immediately. Instead, they might watch whether the next candle closes below the shooting star low. If it does, the rejection becomes more meaningful.
6.4 Marubozu: One Side Dominated the Candle
A marubozu is a candle with little or no wick. A bullish marubozu opens near the low and closes near the high. A bearish marubozu opens near the high and closes near the low. It shows strong directional control during that period.
A bullish marubozu during an uptrend may show strong demand. A bearish marubozu during a downtrend may show strong selling pressure. But beginners should avoid chasing a candle only because it looks powerful. The better question is: is the stock extended, or is it breaking out from a healthy base?
7. Two-Candle Patterns Every Beginner Should Know
7.1 Bullish Engulfing: Buyers Take Back Control
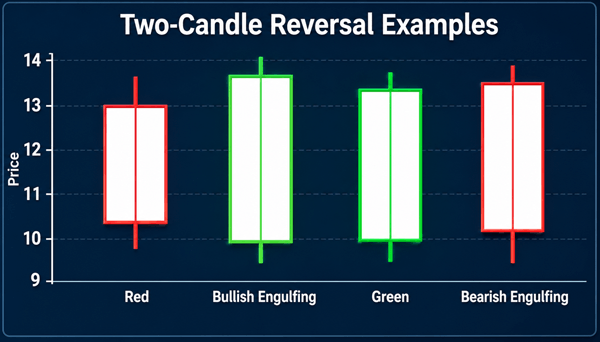
A bullish engulfing pattern forms when a large green candle completely covers, or engulfs, the body of the previous red candle. It usually appears after a decline or pullback.
The idea is simple: sellers were in control on the first candle, but buyers came in strongly on the second candle and reversed the pressure. This can be a useful signal near support or after a controlled pullback in an uptrend.
Practical example: A stock is in a long-term uptrend and pulls back from $70 to $64. Near the 50-day moving average, it forms a bullish engulfing candle with above-average volume. A beginner might see this as a possible bounce setup, but should still define risk, such as exiting if price falls below the engulfing candle low.
7.2 Bearish Engulfing: Sellers Take Back Control
A bearish engulfing pattern forms when a large red candle covers the body of the previous green candle. It often appears after a rally and can warn that sellers are becoming stronger.
This pattern is more meaningful near resistance, after an extended move, or when the broader market is weak. It is less meaningful if it appears randomly inside a messy sideways range.
For investors, a bearish engulfing candle may be a reason to review risk rather than panic sell. For short-term traders, it may become part of a bearish setup if confirmed by trend and volume.
7.3 Piercing Pattern: A Possible Bounce After Selling
A piercing pattern appears after a decline. The first candle is bearish. The second candle opens lower but closes more than halfway into the body of the first candle. This shows sellers had early control, but buyers fought back strongly.
Beginners can think of it as a weaker cousin of the bullish engulfing pattern. It shows improving demand, but not a full takeover. Confirmation from the next candle is helpful.
7.4 Dark Cloud Cover: A Warning After a Rally
Dark cloud cover is the bearish version of the piercing pattern. It appears after an uptrend. The second candle opens higher but closes deep into the previous bullish candle body. It suggests buyers pushed price up early, but sellers took control by the close.
This pattern is useful as a caution sign. It can help beginners avoid buying at the exact moment momentum is fading.
8. Three-Candle Patterns Every Beginner Should Know
8.1 Morning Star: A Three-Step Bullish Reversal
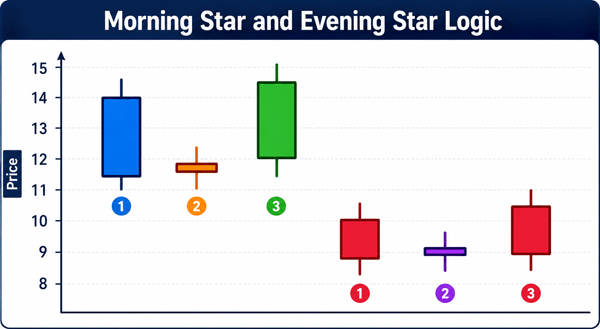
A morning star forms after a decline. The first candle is bearish. The second candle is small, showing hesitation. The third candle is bullish and closes strongly into the first candle body. It tells a three-step story: sellers were strong, then the market paused, then buyers stepped in.
This is one of the most beginner-friendly reversal patterns because the logic is easy to understand. But the best morning star patterns usually appear near a logical support area and are supported by volume or improving market conditions.
8.2 Evening Star: A Three-Step Bearish Reversal
An evening star forms after a rally. The first candle is bullish. The second candle is small. The third candle is bearish and closes strongly downward. It tells the opposite story: buyers were strong, then the market hesitated, then sellers stepped in.
This pattern can help beginners recognize when a strong-looking move may be losing energy. It is especially useful near resistance or after a fast price run.
8.3 Three White Soldiers: Strong Buying Pressure
Three white soldiers are three strong bullish candles in a row, each generally closing higher than the last. This pattern can show strong buying pressure after a decline or breakout.
The warning is that after three strong candles, price may already be stretched. Beginners should avoid buying simply because three green candles appeared. A more careful approach is to wait for a small pullback, check volume, and decide whether the risk-to-reward still makes sense.
8.4 Three Black Crows: Strong Selling Pressure
Three black crows are three bearish candles in a row, each generally closing lower than the last. This can show strong selling pressure after a rally or from a resistance level.
For long-term investors, this pattern can be a reason to review the position, not necessarily a reason to react emotionally. For traders, it may confirm that sellers are in control, but risk management is still required.
9. Comparison Table: Beginner Candlestick Patterns
| Pattern | Type | Best Location | What It Suggests | Beginner Action |
|---|---|---|---|---|
| Doji | Indecision | After strong trend or near key level | Momentum may be slowing | Wait for confirmation |
| Hammer | Bullish reversal clue | After decline near support | Buyers defended lows | Use low as invalidation area |
| Shooting Star | Bearish reversal clue | After rally near resistance | Sellers rejected highs | Wait for lower close |
| Bullish Engulfing | Bullish reversal | After pullback or decline | Buyers regained control | Check volume and risk level |
| Bearish Engulfing | Bearish reversal | After rally | Sellers regained control | Review risk; avoid chasing longs |
| Morning Star | Bullish reversal | After downtrend | Selling pressure may be ending | Confirm with trend/volume |
| Evening Star | Bearish reversal | After uptrend | Buying pressure may be ending | Avoid emotional buying |
| Three White Soldiers | Bullish continuation/reversal | After base or decline | Strong demand | Avoid buying if too extended |
| Three Black Crows | Bearish continuation/reversal | After rally or breakdown | Strong supply | Protect capital; confirm trend |
10. How Beginners Can Use Candlestick Patterns Step by Step
A beginner should not open a stock trading platform, see a pattern, and immediately place an order. A better process is slow, repeatable, and boring. That is what makes it safer.
- Start with the trend. Ask whether the stock is moving up, down, or sideways.
- Mark support and resistance. Patterns near important price levels matter more than patterns in random areas.
- Check volume. A reversal candle with higher volume may carry more weight than one with weak volume.
- Wait for confirmation. Let the next candle support the idea instead of guessing too early.
- Plan the trade before entering. Know your entry area, invalidation level, target area, and position size.
- Record the result. Keep a simple trading journal so you learn from real outcomes, not from memory.
This process is slower than chasing signals, but it is closer to how careful traders use technical analysis in real life. The purpose is not to be right every time. The purpose is to make decisions that are consistent, reviewable, and controlled.
11. Practical Example: Reading a Candlestick Setup Like a Beginner
Imagine a stock has been falling for several days from $100 to $88. On your chart, $87 to $89 has acted as support in the past. The stock opens at $89, drops to $86, then closes at $90.50, forming a hammer with a long lower wick. Volume is higher than average.
A beginner-friendly interpretation might be: sellers tried to push the stock below support, but buyers stepped in and pushed it back above the support zone. This is a possible bullish reversal clue, not a guarantee.
A careful beginner might then wait for the next candle. If the next candle closes above $91 or $92, the setup looks stronger. The hammer low near $86 could become the invalidation level. If price falls below that level, the original reason for the trade is probably no longer valid.
Notice what did not happen: the trader did not buy only because the candle had a name. The trader looked at trend, support, volume, confirmation, and risk.
12. Candlestick Patterns vs. Indicators: What Is the Difference?
Candlestick patterns show price behavior directly. Indicators, such as moving averages, RSI, MACD, and volume indicators, are calculations based on price or volume. Both can be useful, but they answer different questions.
| Tool | What It Shows | Beginner Use |
|---|---|---|
| Candlesticks | Open, high, low, close behavior | Read buyer/seller pressure candle by candle |
| Moving averages | Average trend direction | Filter trades with the larger trend |
| RSI | Possible overbought/oversold conditions | Avoid chasing exhausted moves |
| Volume | How much trading activity occurred | Confirm whether a move has participation |
Many beginners do best with a simple chart: candlesticks, volume, one or two moving averages, and clearly marked support and resistance. Too many indicators can make the chart look professional while making the decision worse.
13. Common Mistakes Beginners Make With Candlestick Patterns
- Memorizing names without understanding the buyer-seller story.
- Using candlesticks without trend, support, resistance, or volume.
- Assuming every pattern is a prediction instead of a probability clue.
- Trading too large because a pattern looks obvious.
- Ignoring news, earnings, market conditions, and liquidity.
- Changing timeframes until a desired pattern appears.
- Not keeping a journal, so the same mistake repeats again and again.
People with real trading experience often say the hardest part is not learning patterns. The hardest part is waiting for quality setups, accepting losses quickly, and not forcing trades when the chart is unclear.
14. Risk Management: The Part Beginners Must Not Skip
Risk management is more important than pattern recognition. A trader can understand every candlestick pattern and still lose money if position size is too large, stop levels are ignored, or trades are taken emotionally.
A simple beginner rule is to decide the maximum amount you are willing to lose before entering any trade. Many cautious traders risk only a small percentage of their account on a single trade. The exact number depends on personal circumstances, but the principle is universal: one trade should not damage your financial life.
- Use stop-loss or invalidation levels based on the chart, not emotion.
- Avoid using leverage until you fully understand the risk.
- Do not trade money needed for rent, bills, emergency savings, or debt repayment.
- Avoid revenge trading after a loss.
- Review trades weekly to identify patterns in your own behavior.
For a beginner, the best stock trading platform is not simply the one with the most tools. It is the one that helps you understand orders, fees, charts, risk controls, and portfolio impact clearly. Educational resources, paper trading, and transparent costs matter.
15. How to Practice Candlestick Patterns Without Risking Money
The safest way to learn candlestick patterns is to practice before using real money. Most modern online brokerage accounts and stock analysis software tools offer watchlists, charting, or paper trading features. Paper trading lets you practice entries and exits without risking capital.
Choose 10 liquid stocks or ETFs and watch them daily.
Mark support, resistance, and trend direction.
Circle candlestick patterns only when they appear at meaningful locations.
Write down what you expected to happen and why.
Review the chart after 5, 10, and 20 candles.
Track whether the pattern worked, failed, or needed better context.
After 50 to 100 practice examples, you will usually learn more than you would from memorizing a list of pattern names. You will start seeing which patterns work better in trends, which fail in choppy markets, and how important confirmation really is.
16. Best Timeframes for Beginners
Beginners often ask which timeframe is best. There is no perfect answer. A daily candlestick is often easier for beginners because it reduces noise and gives more time to think. Very short timeframes, such as one-minute charts, can be stressful and may encourage overtrading.
- Daily charts are useful for swing traders and investors who want slower decisions.
- Hourly charts can help refine entries but still require attention.
- Five-minute or one-minute charts are faster, noisier, and harder for most beginners.
A practical beginner approach is to check the weekly chart for the big picture, the daily chart for the setup, and a shorter timeframe only for timing. This prevents you from making a decision based on one tiny candle while ignoring the larger trend.
17. Candlestick Patterns for Investors vs. Traders
Investors and traders can both use candlesticks, but they use them differently. A long-term investor may use candlestick patterns to improve entry timing, review risk, or avoid buying into obvious weakness. A short-term trader may use them for entries, exits, and stop placement.
For example, an investor building an investment portfolio may not sell a strong company only because one bearish candle appears. But they might use that candle as a reminder to check valuation, earnings, position size, and whether the stock is still aligned with their plan. A trader may react faster because their time horizon is shorter.
This difference matters. A pattern that is important to a day trader may be noise to a long-term investor.
18. Helpful Facts Beginners Should Know
- Candlesticks were popularized from Japanese rice trading history and are now used globally in stocks, forex, crypto, commodities, and ETFs.
- A candlestick pattern on high volume is often more meaningful than the same pattern on weak volume.
- Patterns around earnings announcements can be unreliable because news can overwhelm technical signals.
- Liquid stocks with tight spreads are generally easier for beginners to read than thinly traded penny stocks.
- No pattern has a 100% success rate. The goal is better decision-making, not certainty.
19. Frequently Asked Questions
19.1 Are candlestick patterns good for beginners?
Yes, candlestick patterns can be helpful for beginners because they make price behavior visual. However, beginners should learn them as part of technical analysis, not as guaranteed buy or sell signals.
19.2 Which candlestick pattern is most reliable?
No candlestick pattern is always reliable. Patterns such as bullish engulfing, bearish engulfing, hammer, shooting star, morning star, and evening star can be useful when they appear at the right location with confirmation and volume.
19.3 Can I make money using candlestick patterns?
Candlestick patterns can support trading decisions, but they do not guarantee profit. Results depend on risk management, market conditions, discipline, costs, position sizing, and experience.
19.4 Do candlestick patterns work in all markets?
Candlestick charts are used in stocks, ETFs, forex, crypto, and commodities. But each market behaves differently. A pattern that works well in one market condition may fail in another.
19.5 Should I take a trading course to learn candlesticks?
A good trading course can help if it teaches risk management, realistic examples, journaling, and honest limitations. Be cautious of any course that promises easy profits or secret patterns.
19.6 What is the best way to learn candlestick charts?
The best way is to study the basic candle structure, learn a small group of important patterns, practice on historical charts, paper trade, and keep a journal of what you observe.
20. Beginner Checklist Before Using Any Candlestick Pattern
- Do I know the current trend?
- Is the pattern near support, resistance, a moving average, or a breakout level?
- Does volume support the move?
- Have I waited for confirmation?
- Do I know where the setup is invalid?
- Is my position size reasonable?
- Am I trading because of a plan, not emotion?
- Have I checked major news or earnings dates?
- Can I explain the trade in one simple sentence?
21. Final Thoughts
Candlestick patterns are useful because they help beginners see the battle between buyers and sellers. They turn raw price movement into a story. But the best traders do not rely on patterns alone. They combine candlesticks with context, risk management, patience, and honest review.
Start small. Learn the anatomy of a candle first. Then study a handful of common patterns: doji, hammer, shooting star, engulfing patterns, morning star, evening star, three white soldiers, and three black crows. Practice on charts before risking real money. Most importantly, remember that protecting capital matters more than being right on any single trade.
A candlestick pattern is not a promise. It is a clue. Beginners who understand that one sentence are already ahead of many people who chase patterns without a plan.
Sources Consulted and Checked
The following sources were consulted and checked while preparing this article to support clarity, reliability, and accuracy.
- Investopedia: Candlestick chart definition and basics.
- Charles Schwab: How to read stock charts and trading patterns.
- Fidelity Learning Center: Identifying chart patterns with technical analysis and risk management.
Reader Advice
This article is provided solely for educational and informational purposes. It does not constitute financial, investment, trading, tax, legal, or professional advice, and it should not be treated as a recommendation to buy, sell, or hold any security or financial product.
Candlestick patterns and other technical-analysis methods are based on probabilities and may fail, particularly during volatile markets, low-liquidity conditions, earnings announcements, or unexpected news events. Before making any financial decision, readers should assess their objectives, financial circumstances, risk tolerance, and time horizon; verify current facts, figures, fees, platform features, market rules, and regulatory requirements through official and authoritative sources; and, where appropriate, consult a qualified financial, tax, or legal professional. Rules, products, costs, and market conditions may change over time and may also differ by country, broker, exchange, and individual circumstances. Never trade or invest money that you cannot afford to lose.