How to Read Financial Statements for Stock Market Investing
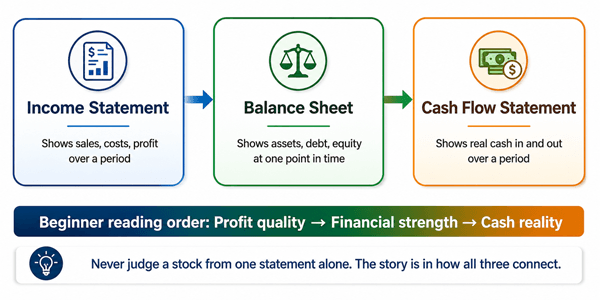
Figure 1: The three main statements work together.
1. Introduction: Financial Statements Are the Company’s Truth Test
When beginners start stock market investing, they often look first at the stock price, a chart, a news headline, or a social media opinion. Those things can be useful, but they do not answer the most important question: what is actually happening inside the business?
Financial statements help answer that question. They show how much money the company earns, what it owns, what it owes, how much real cash it generates, and whether the business is becoming stronger or weaker over time. In simple words, financial statements are the report card of a company.
You do not need to become an accountant to read them. You only need to know where to look, what the numbers mean, and how to connect them to a practical investing decision. This guide explains financial statements in a natural way for someone who has no background in finance. By the end, you should be able to open a company annual report and understand the basic story behind the stock.
Beginner promise The goal is not to memorize accounting terms. The goal is to answer practical investing questions: Is the company growing? Is it profitable? Does it create cash? Is debt under control? Is the stock price reasonable compared with the business quality?
2. What Are Financial Statements?
Financial statements are official reports that summarize a company’s financial performance and financial position. Public companies publish them regularly so investors, lenders, analysts, regulators, and ordinary shareholders can understand the business. In most markets, listed companies release quarterly reports and annual reports.
3. Why They Matter for Investors
A stock is not just a symbol on a trading app. A stock represents ownership in a business. If you buy shares without reading the financial statements, you are buying without checking the engine. The company may look exciting from the outside, but the statements may show weak profits, rising debt, falling cash flow, or shareholder dilution.
- Financial statements help you separate business reality from market hype.
- They show whether growth is supported by profits and cash, not just promises.
- They help you compare one company with another in the same industry.
- They reveal risks that may not appear in headlines, such as heavy debt or declining margins.
- They support long-term investing, retirement planning, dividend investing, and wealth management decisions.
Real-world investor experience Many beginners learn the hard way that a fast-rising stock can still belong to a weak business. Experienced investors usually look for confirmation: price momentum may attract attention, but financial statements help decide whether the business deserves long-term trust.
4. The Four Main Financial Statements
| Statement | Plain-English meaning | Investor question it answers |
|---|---|---|
| Income statement | Shows revenue, expenses, and profit over a period. | Is the company making money from its business? |
| Balance sheet | Shows assets, liabilities, and equity at a specific date. | Is the company financially strong or overloaded with debt? |
| Cash flow statement | Shows cash coming in and going out over a period. | Does the business generate real cash? |
| Statement of shareholders’ equity | Shows changes in ownership value, retained earnings, dividends, and share issuance/buybacks. | Are shareholders gaining or losing ownership value? |
For most beginner stock analysis, start with the first three: income statement, balance sheet, and cash flow statement. Then use the equity statement to understand dividends, buybacks, and dilution.
5. How to Read the Income Statement
The income statement is often the easiest place to start because it follows a familiar path: sales come in, expenses go out, and whatever remains is profit. It covers a period, such as three months or one year.
| Line item | What it means | What to check |
|---|---|---|
| Revenue / sales | Money earned from selling products or services. | Is revenue growing consistently? Is growth real or one-time? |
| Cost of goods sold | Direct cost of producing or delivering what was sold. | Are costs rising faster than revenue? |
| Gross profit | Revenue minus direct costs. | Does the company have pricing power? |
| Operating expenses | Costs such as salaries, research, marketing, rent, and administration. | Is management controlling expenses? |
| Operating income | Profit from the core business before interest and tax. | Is the main business profitable? |
| Net income | Profit after all costs, interest, taxes, and other items. | Is the final profit growing? |
| Earnings per share | Profit divided by shares outstanding. | Are shareholders getting more profit per share? |
5.1 Simple example: reading profit quality
| Item | Year 1 | Year 2 | What it tells you |
|---|---|---|---|
| Revenue | $100 million | $130 million | Sales grew 30%, which looks good. |
| Gross profit | $40 million | $48 million | Gross profit rose, but not as fast as revenue. |
| Operating income | $15 million | $14 million | Core profit fell despite higher sales. |
| Net income | $10 million | $9 million | Final profit also declined. |
A beginner may see 30% revenue growth and think the company is doing great. A more careful investor notices that operating income and net income fell. That may mean the company is growing by spending too much, discounting heavily, or facing cost pressure. Revenue growth is useful only when it eventually turns into profit and cash flow.
Practical rule Do not celebrate revenue growth alone. Ask: How much of each extra dollar of sales becomes profit? If sales rise but profits keep falling, the business may be buying growth instead of earning it.
5.2 Key income statement ratios beginners should know
| Ratio | Formula | Why it matters |
|---|---|---|
| Gross margin | Gross profit / revenue | Shows pricing power and production efficiency. |
| Operating margin | Operating income / revenue | Shows how profitable the core business is. |
| Net profit margin | Net income / revenue | Shows how much final profit remains from each dollar of sales. |
| EPS growth | Change in earnings per share | Shows whether profit is increasing for each share you own. |
Margins are powerful because they turn large numbers into easy comparisons. A $10 billion company and a $100 million company can be compared by asking how much profit they keep from every $1 of sales.
6. How to Read the Balance Sheet
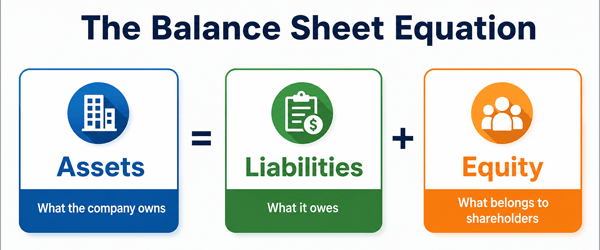
The balance sheet is a snapshot. It tells you what the company owns, what it owes, and what remains for shareholders at one specific date. The basic equation is: assets equal liabilities plus shareholders’ equity.
| Section | Examples | Investor meaning |
|---|---|---|
| Assets | Cash, inventory, receivables, property, equipment, patents, investments. | Resources the company can use to operate and grow. |
| Liabilities | Supplier bills, loans, bonds, leases, taxes payable. | Obligations the company must pay. |
| Shareholders’ equity | Retained earnings, paid-in capital, treasury stock. | Book value belonging to shareholders after liabilities. |
6.1 What beginners should check first on the balance sheet
- Cash and short-term investments: Does the company have enough liquidity to survive difficult periods?
- Total debt: Is debt reasonable compared with profits, cash flow, and assets?
- Current assets vs current liabilities: Can the company cover short-term bills?
- Inventory: Is inventory rising much faster than sales, which may signal weak demand?
- Receivables: Are customers taking longer to pay, which may make revenue quality weaker?
- Shareholders’ equity: Is book value growing over time, or is the company destroying value?
| Company | Cash | Debt | Operating income | Beginner interpretation |
|---|---|---|---|---|
| Company A | $500 million | $200 million | $150 million | Strong liquidity and manageable debt. |
| Company B | $80 million | $900 million | $70 million | Debt may be heavy compared with earnings power. |
This does not automatically mean Company A is a better investment. Price, growth, industry, and management also matter. But from a financial strength angle, Company A gives investors more room for error.
7. How to Read the Cash Flow Statement
The cash flow statement is where many experienced investors spend serious time. The income statement can include accounting estimates, but the cash flow statement shows actual cash movement. A company can report profit and still struggle if customers have not paid, inventory is stuck, or capital spending is too high.
| Cash flow section | What it shows | How investors use it |
|---|---|---|
| Operating cash flow | Cash generated from normal business operations. | Confirms whether reported profits are turning into cash. |
| Investing cash flow | Cash spent on or received from assets, acquisitions, and investments. | Shows whether the company is reinvesting for growth. |
| Financing cash flow | Cash from debt, share issuance, dividends, and buybacks. | Shows how the company funds itself and rewards shareholders. |
7.1 Free cash flow: the number many investors love
Free cash flow is commonly understood as operating cash flow minus capital expenditures. It estimates how much cash is left after the company spends what it needs to maintain and grow its assets. Free cash flow can be used for debt reduction, dividends, share buybacks, acquisitions, or reinvestment.
Simple formula
Free cash flow = Operating cash flow - Capital expenditures| Item | Amount |
|---|---|
| Operating cash flow | $120 million |
| Capital expenditures | -$40 million |
| Free cash flow | $80 million |
If a company produces positive free cash flow year after year, it has more flexibility. It can survive downturns, invest in growth, reduce debt, or return money to shareholders. If free cash flow is negative, ask whether it is because the company is investing wisely for future growth or because the business model cannot fund itself.
8. Statement of Shareholders’ Equity: The Ownership Statement
This statement is often ignored by beginners, but it matters because you are buying ownership. It shows how equity changed during the period. The most practical items are retained earnings, dividends, share issuance, and share buybacks.
| Item | What it means | Why investors care |
|---|---|---|
| Retained earnings | Profits kept in the business instead of paid out. | Can support future growth if management reinvests well. |
| Dividends | Cash paid to shareholders. | Important for income-focused and retirement planning investors. |
| Share buybacks | Company repurchases its own shares. | Can increase each remaining shareholder’s ownership if done at fair prices. |
| Share issuance | Company sells new shares or pays employees in stock. | Can dilute existing shareholders if share count rises too much. |
A company can grow total net income while shareholders do not benefit much if the share count rises too quickly. Always compare net income growth with earnings-per-share growth.
9. How the Three Main Statements Connect
The best way to read financial statements is not one by one in isolation. The real insight comes from connecting them.
| Connection | Example | Investor lesson |
|---|---|---|
| Income statement to cash flow | Net income is adjusted to calculate operating cash flow. | Profit should eventually become cash. |
| Income statement to balance sheet | Net income increases retained earnings after dividends. | Profitable companies can build equity over time. |
| Balance sheet to cash flow | Buying equipment increases assets and appears as capital expenditure. | Growth often needs reinvestment. |
| Debt to income statement | Debt creates interest expense. | High debt can reduce profits. |
Think of the income statement as the movie of profitability, the balance sheet as the photograph of financial position, and the cash flow statement as the bank account movement. A good investor watches all three.
10. A Beginner’s 10-Step Process for Reading Financial Statements
- Start with the business model. Understand how the company makes money before reading numbers.
- Read revenue trends for at least three to five years. Look for steady growth rather than one-year excitement.
- Check gross, operating, and net margins. Stable or rising margins often suggest a stronger business.
- Compare net income with operating cash flow. Cash flow should usually support reported profit over time.
- Calculate free cash flow. See whether the company has cash left after necessary investment.
- Review cash and debt. Avoid companies where debt risk is hard to understand.
- Look at share count. A rising share count can dilute your ownership.
- Read management discussion and footnotes. Important risks often hide in plain English sections, not just tables.
- Compare with competitors. A ratio means more when viewed against similar companies.
- Connect financial quality with valuation. A great company can still be a poor investment if bought at an unreasonable price.
Beginner habit Do not try to understand everything in one sitting. Read the same company for several quarters. Over time, patterns become easier to see.
11. Important Financial Ratios for Stock Market Investing
| Category | Ratio | Formula | Plain-English use |
|---|---|---|---|
| Profitability | Gross margin | Gross profit / revenue | How much money remains after direct costs. |
| Profitability | Operating margin | Operating income / revenue | How efficient the core business is. |
| Profitability | Return on equity | Net income / average equity | How well management uses shareholder capital. |
| Liquidity | Current ratio | Current assets / current liabilities | Ability to pay short-term obligations. |
| Debt risk | Debt-to-equity | Total debt / total equity | How much debt supports the business. |
| Cash quality | Operating cash flow to net income | Operating cash flow / net income | Whether profits are backed by cash. |
| Valuation | Price-to-earnings | Stock price / EPS | How much investors pay for each dollar of earnings. |
| Valuation | Price-to-free-cash-flow | Market value / free cash flow | How much investors pay for cash generation. |
| Dividend | Dividend payout ratio | Dividends / net income | Whether dividends look sustainable. |
Ratios are not magic. They are shortcuts for asking better questions. A low price-to-earnings ratio may mean a stock is cheap, or it may mean the market expects earnings to fall. A high return on equity may mean a wonderful business, or it may be inflated by heavy debt. Always check the story behind the number.
12. Complete Practical Example: Two Companies, Same Industry
Imagine two companies in the same industry. Both sell similar products and both are available in your brokerage account. Which one deserves deeper research?
| Metric | Company Alpha | Company Beta |
|---|---|---|
| Revenue growth | 12% | 25% |
| Operating margin | 18% | 5% |
| Net income growth | 10% | -20% |
| Operating cash flow | Positive and rising | Positive but falling |
| Free cash flow | Strong | Negative |
| Debt level | Moderate | High |
| Share count | Stable | Rising 8% per year |
| P/E ratio | 24 | 18 |
A beginner may choose Beta because revenue is growing faster and the P/E ratio is lower. A more careful investor may prefer Alpha for further study because Alpha has stronger margins, positive free cash flow, moderate debt, and stable share count. Beta may still become a winner, but it carries more questions: Why is profit falling? Why is free cash flow negative? Why is debt high? Why are shareholders being diluted?
Practical lesson The cheapest-looking stock is not always the best value. Value investing is not only about low valuation ratios; it is about paying a sensible price for business quality, cash flow, and durability.
13. Financial Statement Red Flags Beginners Should Notice
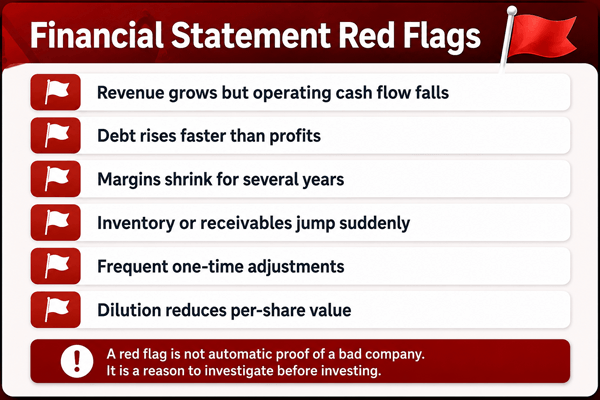
- Revenue is rising but operating cash flow is falling for several periods.
- Net income is positive but free cash flow is consistently negative without a clear growth reason.
- Debt rises faster than operating income or cash flow.
- Gross margin or operating margin declines year after year.
- Inventory grows much faster than revenue, suggesting products may not be selling well.
- Accounts receivable grows much faster than revenue, suggesting customers may be slow to pay.
- The company frequently uses “adjusted” earnings that exclude recurring costs.
- Share count keeps rising, reducing each investor’s ownership.
- Large related-party transactions, legal issues, or unclear footnotes appear repeatedly.
- A dividend is paid even though free cash flow cannot support it.
A red flag does not automatically mean fraud or failure. It means you should slow down. Good investing is often about avoiding avoidable mistakes.
14. Compare Companies the Right Way
Financial statements are most useful when you compare companies in the same industry. A bank, a software company, a retailer, and a utility naturally have different balance sheets, margins, debt levels, and cash flow patterns.
| Business type | What often matters most | Why |
|---|---|---|
| Software | Revenue growth, gross margin, recurring revenue, free cash flow. | Strong software companies can scale with high margins. |
| Retail | Inventory turnover, same-store sales, gross margin, lease obligations. | Retailers can look profitable until inventory and rent pressure appear. |
| Banks | Loan quality, capital ratios, deposits, net interest margin. | Banks are financial institutions; normal debt ratios do not apply the same way. |
| Utilities | Debt, cash flow stability, dividend coverage, regulation. | Utilities often use more debt but may have steadier cash flows. |
| Manufacturing | Capital expenditure, operating margin, working capital, debt. | Factories require ongoing investment and inventory management. |
Do not compare a high-growth technology company with a mature utility using one ratio and call it analysis. The better question is: how does this company perform against similar companies?
15. Do Not Skip the Footnotes
Footnotes explain the accounting choices, debt maturities, lease commitments, legal risks, stock compensation, acquisitions, pension obligations, and revenue recognition policies behind the numbers. Many beginner investors skip them because they look boring. Experienced investors know that footnotes can explain why the headline numbers look better or worse than reality.
- Check debt maturity schedules to see when large payments are due.
- Read revenue recognition notes to understand when the company records sales.
- Review stock-based compensation because it can dilute shareholders.
- Look for legal contingencies or regulatory risks.
- Read segment information to see which part of the business is growing or shrinking.
16. Common Beginner Mistakes When Reading Financial Statements
| Mistake | Why it hurts | Better approach |
|---|---|---|
| Looking only at net income | Profit can be affected by one-time items and accounting estimates. | Compare net income with cash flow and margins. |
| Ignoring debt | Debt can turn a small business problem into a survival problem. | Check debt, interest expense, and maturity dates. |
| Trusting one quarter too much | One quarter may be seasonal or unusual. | Use multi-year trends. |
| Comparing unrelated companies | Different industries have different financial patterns. | Compare with direct competitors. |
| Buying only because P/E is low | Low valuation can reflect real business decline. | Study quality, growth, cash flow, and risk. |
| Ignoring share count | More shares can reduce your ownership percentage. | Track diluted shares outstanding. |
17. How to Use Financial Statements Before Buying a Stock
A practical stock analysis does not end with “the company is good.” You need to connect business quality with the price you are paying. Use financial statements as a filter before making any investment decision.
- Write one sentence explaining how the company makes money.
- Write three numbers: revenue growth, operating margin, and free cash flow.
- Write one risk from the balance sheet, such as debt, inventory, or receivables.
- Write one shareholder issue, such as dilution, buybacks, or dividend coverage.
- Compare valuation with competitors and the company’s own history.
- Decide what would make you change your mind. This protects you from emotional investing.
Honest investing practice
Never invest because an article, influencer, friend, or advertisement says a stock will go up. Use financial statement analysis as part of your own decision process. Consider diversification, emergency savings, tax situation, and personal goals before taking risk.
18. Financial Statements for Dividend Investing
Dividend investors should read financial statements carefully because a high dividend yield can be a warning sign. The key question is not “How big is the dividend?” The key question is “Can the company afford the dividend?”
- Check the dividend payout ratio using net income.
- Check dividend coverage using free cash flow.
- Look at debt levels because debt payments compete with dividends.
- Review the company’s dividend history but do not assume the past guarantees the future.
- Be cautious when a dividend yield is unusually high compared with peers.
19. Financial Statements for Growth Investing
Growth investors often accept lower current profits if a company is building a large future opportunity. But even growth investing needs discipline. Financial statements help you see whether growth is efficient or reckless.
- Revenue should grow for reasons that make business sense, not only through discounts or acquisitions.
- Gross margin should show whether customers value the product.
- Operating losses may be acceptable for young companies, but losses should move toward improvement over time.
- Cash burn matters. A company that constantly needs new funding may dilute shareholders.
- Watch customer acquisition costs, research spending, and management’s path to profitability.
20. Financial Statements and Stock Valuation
Financial statements tell you about the business. Valuation tells you how much the market is asking you to pay for that business. Both matter. A weak company can be too expensive even at a low price. A strong company can also be too expensive if expectations are unrealistic.
| Valuation metric | Best used for | Limitation |
|---|---|---|
| P/E ratio | Profitable companies with stable earnings. | Can be misleading if earnings are temporarily high or low. |
| Price-to-sales | Early-stage or low-profit growth companies. | Ignores expenses and cash flow. |
| Price-to-free-cash-flow | Companies with meaningful cash generation. | Can swing if capital spending is uneven. |
| EV/EBITDA | Comparing companies with different debt levels. | Can ignore capital expenditure needs. |
| Dividend yield | Income-focused investments. | High yield may signal risk, not opportunity. |
A good valuation question is: “What future growth and profitability does this price already assume?” If the stock price already assumes perfection, even a good company can disappoint investors.
21. Beginner Financial Statement Checklist
| Question | Yes/No/Notes |
|---|---|
| Do I understand how the company makes money? | |
| Has revenue grown steadily over several years? | |
| Are gross and operating margins stable or improving? | |
| Is net income supported by operating cash flow? | |
| Is free cash flow positive or clearly explained if negative? | |
| Does the company have enough cash and manageable debt? | |
| Is share count stable or decreasing? | |
| Are dividends or buybacks supported by cash flow? | |
| Are there worrying footnotes or repeated one-time adjustments? | |
| Is the valuation reasonable compared with quality and competitors? |
22. Frequently Asked Questions
22.1 Do I need accounting knowledge to read financial statements?
No. Basic accounting helps, but beginners can start by understanding revenue, profit, debt, cash flow, and share count. You can learn more details over time.
22.2 Which financial statement should I read first?
Start with the income statement to understand sales and profit. Then check the balance sheet for financial strength. Finally, read the cash flow statement to confirm whether profit turns into cash.
22.3 Is profit more important than cash flow?
Both matter. Profit shows accounting performance, while cash flow shows real cash movement. Over time, strong companies usually need both profits and healthy cash flow.
22.4 Can a company be profitable but still risky?
Yes. A company may report profit while carrying heavy debt, weak cash flow, falling margins, or major legal risks.
22.5 What is the most beginner-friendly ratio?
Net profit margin and current ratio are easy starting points. But no single ratio is enough. Always look at trends and compare with competitors.
22.6 How many years of statements should I review?
Three to five years is a good beginner target. It helps you see patterns rather than reacting to one quarter.
22.7 Should I use stock analysis software?
Stock analysis software, broker screeners, and financial websites can save time, but they should not replace reading the actual annual report and notes.
22.8 Should I talk to a financial advisor?
If you are unsure about risk, taxes, retirement planning, portfolio allocation, or whether individual stocks fit your situation, a qualified financial advisor can help. Always understand fees and conflicts before hiring anyone.
23. Final Thoughts: Read the Business, Not Just the Stock
Financial statements are not there to make investing complicated. They are there to make investing more honest. They help you slow down, check facts, and think like a business owner rather than a gambler.
For beginners, the best approach is simple: understand the business, check profitability, confirm cash flow, review debt, watch share count, compare with competitors, and avoid stocks you cannot explain. Over time, this habit can improve your stock analysis, protect your investment portfolio, and support better long-term financial decisions.
The stock market will always have noise. Financial statements help you focus on the signal.
Sources Consulted and Checked
These sources were consulted while preparing and checking this article for clarity, accuracy, and reader usefulness.
| Source | Purpose |
|---|---|
| U.S. Securities and Exchange Commission: Beginners’ Guide to Financial Statements | Core explanation of the main financial statements. |
| FINRA investor education on using financial statements | Investor-focused framing and practical statement uses. |
| Investor.gov introduction to investing | Risk-aware, goal-based investing context. |
This article is provided solely for educational and informational purposes. It is not financial, investment, tax, accounting, or legal advice, and it does not recommend buying, selling, or holding any security. Financial statements, market conditions, laws, regulations, accounting standards, tax rules, company disclosures, and other relevant facts may change over time and may differ by country, industry, and individual circumstances.
Before making any investment or financial decision, conduct independent research, verify current facts and figures through official company filings and reliable regulatory sources, consider your goals, time horizon, risk tolerance, diversification, liquidity needs, and tax position, and seek advice from a suitably qualified professional when appropriate. Past performance does not guarantee future results, and all investments involve risk, including possible loss of principal.