What Is the P/E Ratio in Stock Market Investing and Why Does It Matter?
1. Quick answer: what is the P/E ratio?
The P/E ratio, also called the price-to-earnings ratio, is a simple way to compare a company’s stock price with the profit the company earns. In plain English, it tells you how much investors are paying for each $1 of the company’s earnings.
For example, if a stock trades at $50 and the company earns $5 per share, the P/E ratio is 10. That means investors are paying $10 for every $1 of annual earnings. A P/E of 25 means investors are paying $25 for every $1 of earnings. A P/E of 8 means they are paying $8 for every $1 of earnings.
This does not automatically mean a low P/E stock is good or a high P/E stock is bad. The P/E ratio is a starting point, not a final decision. It is like checking the price tag before buying something: helpful, but not enough by itself.
2. P/E ratio formula
P/E ratio = Current share price / Earnings per share (EPS)
EPS means earnings per share. It shows how much profit belongs to each share of stock. The U.S. SEC’s Investor.gov explains the same basic formula: current stock price divided by current earnings per share, with EPS based on earnings divided by common shares outstanding.
Simple example
| Company | Stock price | EPS | P/E ratio |
|---|---|---|---|
| Company A | $100 | $5 | 20x |
| Company B | $100 | $10 | 10x |
| Company C | $50 | $5 | 10x |
Company A and Company B have the same stock price, but Company B earns more per share, so its P/E is lower. Company B and Company C have the same P/E, even though their stock prices are different. This is why experienced investors do not judge a stock by price alone. A $20 stock can be expensive, and a $500 stock can be reasonable, depending on earnings.
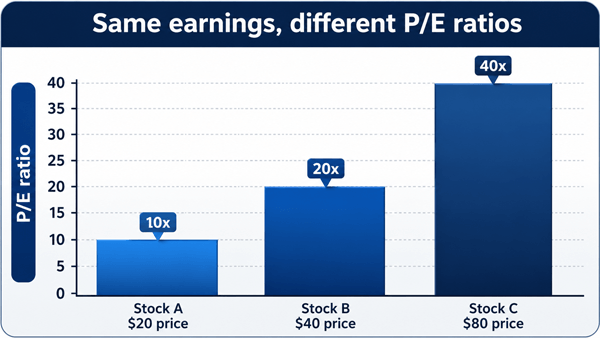
Figure 1: The same EPS can produce very different P/E ratios when the share price changes.
3. Why does the P/E ratio matter?
The P/E ratio matters because it gives beginners a quick way to ask an important question: “Am I paying a reasonable price for this company’s earnings?” That question sits at the center of stock market investing, value investing, growth investing, retirement planning, and long-term wealth building.
A stock is not just a ticker symbol moving up and down on an online trading app. Behind the ticker is a business. The P/E ratio connects the stock market price to the business profit. That connection helps you avoid one of the most common beginner mistakes: buying only because a stock is popular, cheap-looking, trending on social media, or mentioned by influencers.
3.1 What a high P/E ratio can mean
- Investors expect strong future growth.
- The company may have a powerful brand, loyal customers, or high profit margins.
- The stock may be overvalued if expectations are too optimistic.
- The company may need years of future growth just to justify today’s price.
3.2 What a low P/E ratio can mean
- The stock may be undervalued compared with its earnings.
- The company may be mature, slow-growing, cyclical, or unpopular.
- The market may be worried about debt, falling profits, lawsuits, regulation, or weak future demand.
- It may be a value opportunity, or it may be a value trap.
This is where many real investors learn a painful lesson: a low P/E ratio is not automatically a bargain. Sometimes the stock is cheap because the business is weakening. Sometimes a high P/E stock keeps rising because earnings growth is much stronger than the market expected. The ratio is useful, but it needs context.
4. Trailing P/E vs forward P/E
| Type | What it uses | Beginner takeaway |
|---|---|---|
| Trailing P/E | Actual earnings from the past 12 months | More factual, but backward-looking. |
| Forward P/E | Analyst estimates of future earnings | More growth-focused, but based on forecasts that can be wrong. |
Beginners often see both numbers on financial websites, stock screeners, brokerage platforms, and investment research tools. Trailing P/E is usually easier to trust because it uses reported earnings. Forward P/E can be helpful, but it depends on assumptions about future profits. When earnings forecasts change, forward P/E can change quickly.
5. How beginners can use the P/E ratio in real investing
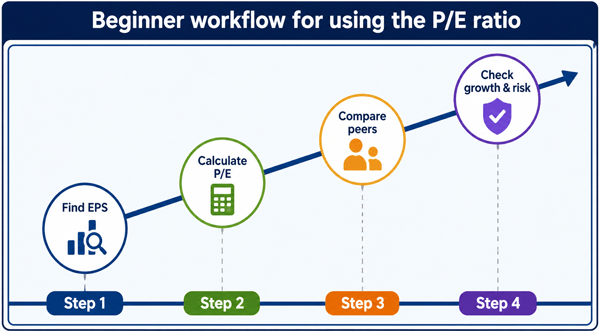
Figure 2: A simple beginner workflow for using the P/E ratio in stock analysis.
5.1 Step 1: Compare companies in the same industry
The most practical use of the P/E ratio is comparison. But compare similar companies, not completely different businesses. A bank, a software company, a grocery chain, and a biotech company can have very different normal P/E ranges because their growth rates, risks, profit margins, and capital needs are different.
A beginner-friendly rule: compare a stock’s P/E with direct competitors, its own five-year or ten-year history, and the broader market only as a rough reference.
5.2 Step 2: Ask why the P/E is high or low
Do not stop at “high” or “low.” Ask why. A high P/E may be reasonable if the company is growing earnings quickly, has a wide competitive moat, and reinvests profit at high returns. A low P/E may be reasonable if earnings are shrinking, debt is heavy, or the industry is under pressure.
5.3 Step 3: Match P/E with growth
Many investors compare P/E with expected earnings growth. A company with a P/E of 30 growing earnings 25% a year may be more attractive than a company with a P/E of 12 whose earnings are falling. This is why some investors also look at the PEG ratio, which compares the P/E ratio with growth. PEG is not perfect, but it reminds beginners that valuation and growth should be considered together.
5.4 Step 4: Use P/E with other financial ratios
The P/E ratio should sit beside other tools, not replace them. Before buying any stock, beginners should also look at revenue growth, profit margins, debt levels, free cash flow, return on equity, dividend safety, and business quality. A stock market investing decision based on only one ratio is usually weak.
6. Practical example: two stocks with the same P/E can be very different
| Metric | Stock X | Stock Y | What beginner should notice | Possible conclusion |
|---|---|---|---|---|
| P/E ratio | 15x | 15x | Same valuation by this one metric | Need more information |
| Earnings growth | 12% per year | -5% per year | One is growing, one is shrinking | Stock X may deserve the same or higher P/E |
| Debt | Low | High | High debt can increase risk | Stock Y may be cheaper for a reason |
| Cash flow | Strong | Weak | Accounting profit is not always cash profit | Stock X may be higher quality |
| Industry trend | Expanding | Declining | Industry matters | Stock Y may be a value trap |
This example shows why the P/E ratio is useful but incomplete. Many beginners buy the lower-looking valuation without asking whether the business is healthy. Experienced investors usually want both a fair price and a good business.
7. Common beginner mistakes with the P/E ratio
- Thinking a low P/E always means “cheap.” It may mean the company is in trouble.
- Thinking a high P/E always means “overpriced.” It may reflect strong growth expectations.
- Comparing different industries as if they should have the same normal P/E.
- Ignoring negative earnings. If a company loses money, P/E may be meaningless or shown as N/A.
- Using one year of unusually high or low earnings. Cyclical companies can look cheap at the top of the cycle and expensive at the bottom.
- Ignoring debt, cash flow, share dilution, and one-time accounting gains.
- Buying based on a stock screener without reading the company’s actual business story.
8. When the P/E ratio is less useful
The P/E ratio works best for companies with stable and meaningful earnings. It is less useful for early-stage growth companies, startups, biotech firms waiting for approvals, turnaround companies, highly cyclical businesses, and companies with temporarily depressed or temporarily inflated profits.
For companies with little or no earnings, investors may use other valuation methods, such as price-to-sales ratio, enterprise value to EBITDA, discounted cash flow analysis, free cash flow yield, or asset-based valuation. These tools are more advanced, but the basic idea is the same: compare what you pay with what the business can realistically produce.
9. P/E ratio comparison cheat sheet
| Situation | What it may suggest | What to check next |
|---|---|---|
| P/E is much higher than peers | Market expects faster growth or stronger quality | Revenue growth, margins, moat, analyst expectations |
| P/E is much lower than peers | Potential bargain or hidden risk | Debt, declining earnings, lawsuits, industry pressure |
| P/E is close to peers | Market may be pricing it normally | Business quality, balance sheet, future catalysts |
| P/E is negative or N/A | Company has no positive earnings | Cash burn, revenue growth, funding needs |
| P/E suddenly drops | Price fell, earnings rose, or both | Reason for price move and earnings quality |
10. How to read P/E like a practical investor
- Start with the formula so you know what the number means.
- Compare the company with similar businesses, not random stocks.
- Look at both trailing P/E and forward P/E.
- Check whether earnings are growing, stable, or falling.
- Read the latest earnings report or reliable stock analysis summary.
- Check debt, free cash flow, profit margins, and competitive position.
- Decide whether the valuation gives you a margin of safety.
- Avoid treating P/E as a buy or sell signal by itself.
11. Real-world investor experience: what people usually learn over time
Many beginners first use the P/E ratio as a shortcut. They screen for low P/E stocks, assume they found bargains, and later discover that some companies were cheap because profits were about to fall. Others avoid high P/E stocks completely and watch strong businesses compound for years because earnings kept growing. The practical lesson is balance: P/E tells you what the market is paying today, but future returns depend on what the business earns tomorrow.
A more mature way to think is this: “What am I paying, what am I getting, and how confident am I that the earnings will improve or at least stay strong?” That question turns the P/E ratio from a simple number into a real investment analysis tool.
12. Frequently Asked Questions
12.1 What is a good P/E ratio?
There is no single good P/E ratio for every stock. A good P/E depends on the company’s industry, growth rate, profit quality, debt, interest rates, and risk. A P/E of 10 may be expensive for a declining company, while a P/E of 30 may be reasonable for a company growing earnings quickly.
12.2 Is a low P/E ratio better?
Not always. A low P/E can mean a stock is undervalued, but it can also mean investors expect weak future earnings. Beginners should check why the P/E is low before assuming it is a bargain.
12.3 Is a high P/E ratio bad?
Not always. A high P/E can mean the stock is expensive, but it can also mean the company has strong growth expectations, a durable brand, high margins, or a powerful competitive advantage.
12.4 Can I use the P/E ratio for every stock?
No. P/E is less useful when a company has no earnings, negative earnings, highly unstable earnings, or unusual one-time profits. In those cases, other valuation methods may be more useful.
12.5 Should beginners buy stocks only based on P/E ratio?
No. Beginners should use the P/E ratio as one part of a broader checklist that includes business quality, growth, debt, cash flow, diversification, risk tolerance, and long-term goals.
12.6 Where can I find the P/E ratio?
Most brokerage accounts, financial news websites, stock screeners, and investment research platforms show P/E ratio. Still, it is useful to know the formula so you understand what the number means.
13. Final takeaway
The P/E ratio is one of the easiest stock valuation tools for beginners because it connects the stock price with company earnings. It helps answer a simple but powerful question: “How much am I paying for this company’s profit?”
Used wisely, the P/E ratio can help investors compare stocks, avoid hype, spot possible bargains, and understand market expectations. Used carelessly, it can lead to bad decisions because it ignores growth, risk, debt, and business quality. The best approach is honest and practical: use P/E as a first filter, then study the business behind the number.
Reader Advice
This article is provided solely for educational and informational purposes and does not constitute personalized financial, investment, legal, or tax advice. Investment decisions should be based on your own objectives, financial circumstances, risk tolerance, and independent research. Before acting, consider consulting a qualified professional. Market conditions, company results, valuation measures, laws, regulations, tax rules, platform features, and published data can change over time and may differ by country or individual situation.
Readers should therefore verify important facts, figures, formulas, and current requirements through company filings, regulators, and other official or reliable sources. All investing involves risk, including the possible loss of principal, and no return is guaranteed.
Sources Consulted and Checked
The following sources were consulted and checked while preparing this article to support clarity and accuracy.
- SEC Investor.gov - Price-earnings (P/E) Ratio
- Charles Schwab - Stock analysis using the P/E ratio
- Fidelity - What is price-to-earnings ratio?
- Investopedia - Price-to-Earnings Ratio