VUG vs QQQ: Holdings, Performance, and Which ETF Is Best?
Quick answer: VUG is usually the cleaner choice for a low-cost, broad large-cap growth allocation. QQQ is usually the more concentrated choice for investors who specifically want Nasdaq-100 exposure and are comfortable with heavier mega-cap technology concentration. Neither fund is automatically “best” for every person; the better ETF depends on your time horizon, risk tolerance, existing holdings, tax situation, and whether you already own broad-market funds like VOO, VTI, or an S&P 500 index fund.
1. VUG vs QQQ at a glance
| Feature | VUG - Vanguard Growth ETF | QQQ - Invesco QQQ ETF |
|---|---|---|
| Main idea | Broad U.S. large-cap growth ETF | Nasdaq-100 ETF focused on the 100 largest non-financial Nasdaq companies |
| Index tracked | CRSP US Large Cap Growth Index | Nasdaq-100 Index |
| Expense ratio | 0.03% as of April 2026 [2] | 0.18% total expense ratio [3] |
| Number of holdings | About 157-159 holdings in recent data [4] | About 102-104 holdings in recent data [3][4] |
| Main strength | Low cost and broader growth exposure | Highly liquid, famous, concentrated Nasdaq growth exposure |
| Main weakness | Still concentrated in mega-cap growth stocks | More concentrated, higher fee, and less diversified by exchange/index design |
| Beginner-friendly summary | Better as a core growth tilt for many long-term investors | Better as a satellite holding for investors who knowingly want Nasdaq-100 exposure |
2. What is VUG?
VUG, the Vanguard Growth ETF, is an exchange-traded fund that gives investors exposure to large U.S. companies with growth characteristics. In simple words, it owns companies that the index classifies as having stronger growth traits than value traits. These companies often reinvest heavily, grow sales quickly, and trade at higher valuations because investors expect future earnings to be larger.
VUG is not a “technology ETF,” but technology and technology-like mega-cap companies are a major part of the fund because many of today’s biggest growth companies are in software, semiconductors, cloud computing, digital advertising, artificial intelligence, e-commerce, and platform businesses. Recent holdings data shows VUG’s top positions include NVIDIA, Apple, Microsoft, Alphabet, Broadcom, Amazon, Meta, Tesla, and Eli Lilly. [5]
3. What is QQQ?
QQQ, the Invesco QQQ ETF, tracks the Nasdaq-100 Index. That index includes 100 of the largest non-financial companies listed on the Nasdaq exchange. The important beginner point is this: QQQ is not simply “the best 100 companies” or “the top 100 tech stocks.” It is an index built around Nasdaq-listed, non-financial companies. Because many large innovative companies list on Nasdaq, the fund has become heavily associated with technology, AI, semiconductors, software, internet platforms, and consumer growth companies.
QQQ is popular because it is simple to understand, highly traded, and has a long history. Invesco states that QQQ tracks the Nasdaq-100 and is passively managed. Invesco lists its total expense ratio at 0.18% and recent holdings count at 102. [3]
4. How ETFs like VUG and QQQ work
An ETF is a basket of investments that trades on an exchange like a stock. When you buy one share of an ETF, you indirectly own a small slice of all the companies inside that ETF. Investor.gov explains that ETFs pool money from investors, hold a portfolio of securities, and trade during the day at market prices. [6]
For a beginner, the practical benefit is convenience. Instead of buying NVIDIA, Apple, Microsoft, Amazon, Meta, and dozens of other companies separately, you can buy one ETF and receive instant exposure. The tradeoff is that you do not control the exact weights. If the index gives one stock a large weight, your ETF will also be affected heavily by that stock.
5. Holdings comparison: what do VUG and QQQ actually own?
The biggest misunderstanding about VUG vs QQQ is that they are totally different. They are not. Both funds own many of the same mega-cap growth companies. The difference is how much they own and what rules decide the portfolio.
| Top holding area | VUG example weight | QQQ example weight | Why it matters |
|---|---|---|---|
| NVIDIA | About 13.1%-13.3% | About 8.1%-9.9% | AI and semiconductor exposure is large in both funds. |
| Apple | About 12.3%-12.7% | About 7.3%-8.3% | Both funds are affected by Apple’s product cycle and services growth. |
| Microsoft | About 8.7%-9.0% | About 5.3%-8.3% | Both funds have cloud, AI, and enterprise software exposure. |
| Broadcom | About 4.7%-5.2% | About 5.7% in ETFRC overlap data | Semiconductors and infrastructure software overlap. |
| Amazon | About 4.6%-4.9% | About 5.1% in ETFRC overlap data | E-commerce, cloud, advertising, and consumer growth exposure. |
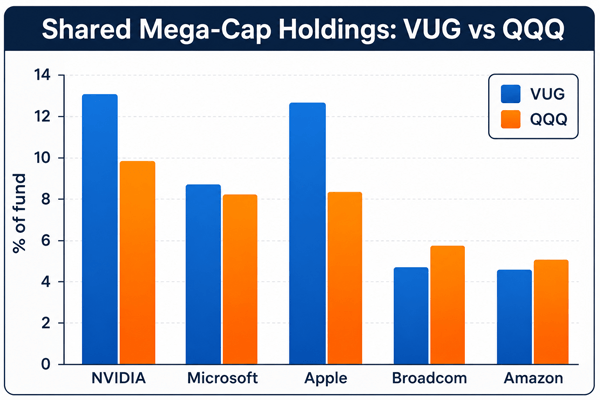
Figure: Shared mega-cap holdings can make VUG and QQQ move similarly during technology-led markets. Holdings change over time, so always check the latest fund pages before investing.
6. ETF overlap: the hidden issue beginners miss
ETF overlap means two ETFs own the same companies. ETFRC’s fund overlap tool recently showed VUG and QQQ with 63% overlap by weight and 53 overlapping holdings. It also showed 36% of VUG’s holdings were also in QQQ, while 52% of QQQ’s holdings were also in VUG. [4]
This matters because many investors buy VUG and QQQ together thinking they are adding diversification. In reality, they may simply be buying more of the same giant companies. That is not always bad, but it should be intentional. If you already own VOO, VTI, SPY, or an S&P 500 index fund, you probably already own many of the same names. Adding both VUG and QQQ can make your portfolio more dependent on the same mega-cap growth stocks.
7. Performance comparison: which has performed better?
Historically, QQQ has often produced very strong long-term returns because the Nasdaq-100 benefited from the rise of mega-cap technology, software, cloud computing, e-commerce, semiconductors, and AI. Invesco states that QQQ has outperformed the S&P 500 on a cumulative basis since its 1999 launch, using performance data through March 31, 2026. [3]
VUG has also been a strong growth ETF. Vanguard data showed VUG’s year-to-date market-price return at 7.09% as of June 18, 2026, and Vanguard’s March 31, 2026 investment profile listed 1-year, 3-year, 5-year, and 10-year total return figures for the fund. [2][7]
The honest takeaway: past performance can help you understand volatility and market behavior, but it should not be the only reason to buy. QQQ may win during Nasdaq-led bull markets. VUG may feel more balanced because it holds more names and follows a broad growth index. Either fund can fall sharply when investors rotate away from expensive growth stocks.
| Performance lens | What usually helps VUG | What usually helps QQQ |
|---|---|---|
| Tech-led bull market | Strong, because VUG owns many mega-cap growth leaders | Often very strong, because QQQ is more concentrated in Nasdaq growth leaders |
| Growth-stock selloff | Can decline sharply, but broader growth exposure may soften some single-index concentration | Can decline sharply because it is concentrated and valuation-sensitive |
| Long holding period | Low fee supports long-term compounding | Long history and liquidity support long-term use, but fee is higher than VUG |
| Diversification need | Usually better if you want a growth tilt rather than a Nasdaq-specific bet | Usually better if you specifically want Nasdaq-100 exposure |
8. Fees: VUG is cheaper, but QQQ is still not expensive
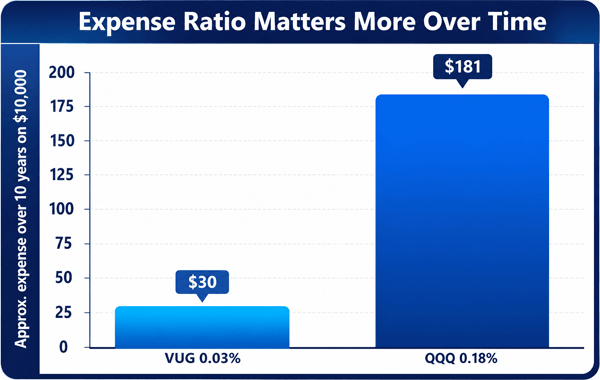
VUG’s expense ratio is one of its biggest advantages. Vanguard lists VUG’s expense ratio at 0.03% as of April 2026. QQQ’s total expense ratio is 0.18%. [2][3]
On $10,000, the simple first-year cost difference is about $3 for VUG versus $18 for QQQ, before any compounding effects. That $15 difference is not huge for one year, but fees become more meaningful across decades and larger balances. For example, on $100,000, the first-year fee difference is about $150. On $500,000, it is about $750 per year. This is why expense ratio matters for long-term ETF investing.
9. Risk comparison: what can go wrong?
The biggest risk in both VUG and QQQ is not that they are “bad ETFs.” The risk is that investors may use them incorrectly. Both funds lean toward growth stocks, and growth stocks can become expensive when investor expectations are high. If earnings disappoint, interest rates rise, or the market stops paying premium valuations for AI and technology leaders, both ETFs can fall.
| Risk | VUG | QQQ | Beginner takeaway |
|---|---|---|---|
| Concentration risk | High, but spread across more holdings | Higher because fewer holdings and Nasdaq-100 design | Do not assume either fund is fully diversified. |
| Sector/style risk | Large-cap growth risk | Large-cap growth plus Nasdaq concentration | Both can struggle when value, dividends, or defensive sectors lead. |
| Valuation risk | Growth companies may trade at premium prices | Same issue, often more pronounced | Great companies can still be poor buys at the wrong price. |
| Single-stock influence | Top 10 holdings are very large | Top 10 holdings are also very large | A few mega-caps can drive returns. |
| Behavior risk | Investors may chase performance after big rallies | Investors may chase QQQ because of its famous history | Have a plan before buying, not after a drawdown. |
10. Which ETF is best for beginners?
For many beginners, VUG is easier to justify as a long-term growth tilt because it is cheaper and broader. It can sit next to a total-market ETF or S&P 500 ETF as a way to lean more toward growth companies without making the entire portfolio a Nasdaq-100 bet.
QQQ can still be a good ETF for the right investor. It may fit someone who deliberately wants exposure to the Nasdaq-100, understands the concentration, accepts volatility, and is not simply chasing recent returns. QQQ is also extremely liquid, which matters more for traders and institutions than for a beginner investing $100 or $500 per month.
| Investor situation | More practical choice | Reason |
|---|---|---|
| Beginner building a simple long-term portfolio | VUG, or even a broader fund first | Lower fee and broader growth exposure; beginners may first need broad-market diversification. |
| Investor already owns VTI or VOO and wants a modest growth tilt | VUG | Adds growth exposure without being as Nasdaq-specific as QQQ. |
| Investor wants direct Nasdaq-100 exposure | QQQ | QQQ is designed for that exact index. |
| Investor is worried about overlap with existing S&P 500 holdings | Neither, or use a small allocation | Both overlap heavily with common broad-market funds. |
| Investor wants lowest-cost Nasdaq-100-like exposure | Consider QQQM instead of QQQ | QQQM is often used by long-term investors because it has a lower expense ratio than QQQ, though this article focuses on VUG vs QQQ. |
11. Practical portfolio examples
These examples are not recommendations. They show how a beginner might think about ETF placement inside a portfolio.
| Example | Possible allocation idea | Why it might make sense | Main caution |
|---|---|---|---|
| Simple core investor | 80%-100% broad-market ETF; 0%-20% VUG | Keeps the portfolio simple and uses VUG only as a growth tilt | Too much growth tilt can reduce diversification. |
| Nasdaq believer | 70%-90% broad-market ETF; 10%-30% QQQ | Allows targeted Nasdaq exposure without making QQQ the whole portfolio | QQQ can be volatile and may duplicate existing holdings. |
| Aggressive growth investor | 60%-80% broad-market ETF; 20%-40% VUG or QQQ | Higher growth exposure for a long horizon | Drawdowns can be uncomfortable; avoid panic selling. |
| Retirement-near investor | Use caution; prioritize full asset allocation first | Growth ETFs can still be useful, but risk control matters more near retirement | Sequence-of-return risk and volatility matter. |
12. How to decide between VUG and QQQ in 5 steps
- Check your core holdings first. Look at your 401(k), IRA, brokerage account, and any index funds you already own. If you already own VOO, VTI, SPY, or an S&P 500 fund, you already have meaningful exposure to the biggest companies inside VUG and QQQ.
- Decide whether you want “growth” or “Nasdaq.” If you want a general large-cap growth tilt, VUG usually matches that goal better. If you specifically want Nasdaq-100 exposure, QQQ is the direct tool.
- Compare fees and holding period. VUG’s lower fee is attractive for buy-and-hold investors. QQQ’s higher fee may be acceptable if you value its index, trading liquidity, and long history.
- Set an allocation limit before buying. A practical beginner rule is to decide the percentage in advance, such as 5%, 10%, or 20% of the stock portfolio, rather than buying more after every rally.
- Rebalance once or twice a year. If your growth ETF becomes too large after a strong run, rebalance back to your target. This forces discipline and reduces emotional decision-making.
13. Common mistakes people make with VUG and QQQ
- Buying both without checking overlap. Owning both can be fine, but it is not automatically diversified.
- Using recent performance as the only reason. Strong past returns can attract investors near market highs.
- Ignoring valuation and concentration. A fund can hold excellent companies and still be risky if expectations are too high.
- Thinking ETFs cannot lose much money. Growth ETFs can fall sharply during bear markets.
- Making the ETF the whole portfolio. A complete portfolio may include broad U.S. stocks, international stocks, bonds, cash reserves, or other assets depending on the investor.
14. Frequently Asked Questions: VUG vs QQQ
14.1 Is VUG better than QQQ?
VUG may be better for investors who want lower cost and broader large-cap growth exposure. QQQ may be better for investors who specifically want Nasdaq-100 exposure. Better depends on the investor, not just the return chart.
14.2 Is QQQ more risky than VUG?
Usually, QQQ can be considered more concentrated because it follows the Nasdaq-100 and holds fewer companies. VUG is also risky because it is growth-focused and heavily weighted toward mega-cap growth companies.
14.3 Can I hold both VUG and QQQ?
Yes, but check overlap first. Holding both often increases exposure to the same mega-cap technology and growth stocks.
14.4 Is VUG good for long-term investing?
VUG can be useful as a long-term growth tilt, especially for investors who understand that growth stocks can have big drawdowns.
14.5 Is QQQ good for beginners?
QQQ is easy to buy and understand, but beginners should not confuse popularity with suitability. It is best used when the investor understands Nasdaq-100 concentration.
14.6 Which ETF has lower fees, VUG or QQQ?
VUG has the lower expense ratio at 0.03%, while QQQ’s total expense ratio is 0.18% based on current fund data used in this article. [2][3]
14.7 Does VUG pay dividends?
Yes, but income is not the main reason most investors buy VUG. Growth ETFs often have lower yields than dividend-focused funds.
14.8 Does QQQ pay dividends?
Yes, but QQQ is mainly used for growth exposure rather than income.
15. Final verdict: VUG or QQQ?
VUG is the more practical default choice for many long-term investors who want a low-cost growth ETF. It is broader, cheaper, and easier to use as a growth tilt inside a diversified portfolio.
QQQ is the better fit for investors who specifically want Nasdaq-100 exposure and are comfortable with a more concentrated portfolio. It has a famous track record, strong liquidity, and a clear identity, but it should not be treated as a complete portfolio by itself.
The most honest answer is this: choose VUG if you want broad, low-cost large-cap growth exposure. Choose QQQ if you want a focused Nasdaq-100 ETF. Choose neither until you understand how either fund changes your total portfolio risk.
Sources Consulted and Checked
The following sources were consulted and checked while preparing this article and reviewing its factual accuracy. Fund data can change, so readers should confirm current details on official fund pages and prospectuses.
- [1] Investor.gov / SEC: ETF basics, risks, and reminder that past performance does not predict future returns. https://www.investor.gov/introduction-investing/investing-basics/investment-products/mutual-funds-and-exchange-traded-2
- [2] Vanguard: VUG expense ratio and performance data from Vanguard fund materials and profile pages. https://investor.vanguard.com/investment-products/etfs/profile/vug
- [3] Invesco: QQQ index description, expense ratio, holdings count, and performance statements from Invesco QQQ materials. https://www.invesco.com/qqq-etf/en/home.html
- [4] ETFRC: VUG vs QQQ overlap by weight and overlapping holdings. https://www.etfrc.com/funds/overlap.php?f1=VUG&f2=QQQ
- [5] Schwab / ETF holdings data: VUG total holdings and top holdings snapshot. https://www.schwab.wallst.com/schwab/Prospect/research/etfs/schwabETF/index.asp?symbol=VUG&type=holdings
- [6] Yahoo Finance / market data: Top holdings snapshots and market data cross-checks for VUG and QQQ. https://finance.yahoo.com/quote/VUG/
- [7] Vanguard investment profile PDF: VUG returns as of March 31, 2026. https://workplace.vanguard.com/assets/corp/fund_communications/pdf_publish/us-products/investment-profiles/0967.pdf
Reader Advice
This article is provided solely for educational and general informational purposes. It does not constitute personalized investment, financial, tax, legal, or other professional advice; it is not a recommendation or solicitation to buy, sell, or hold any security; and it does not promise or guarantee future results.
Investment decisions should be based on your objectives, time horizon, risk tolerance, financial circumstances, existing portfolio, tax position, and other relevant factors. Before acting, review the latest prospectus and official fund materials and consider consulting an appropriately qualified and licensed professional.
ETF holdings, index rules, sector weights, fees, distributions, performance figures, laws, tax rules, and regulatory requirements may change. Dates and figures in this article reflect the sources available when it was last reviewed. Verify all material facts and figures with official and current sources before making any decision. Past performance does not predict future returns, and investments may lose value, including principal.