U.S. Stocks vs European Stocks: Key Differences and Performance Compared
1. Quick answer: which market is better?
There is no permanently “better” market. U.S. stocks have delivered stronger returns in many recent periods, largely because the U.S. market is more concentrated in high-growth technology and platform businesses. European stocks often look cheaper, pay higher dividends, and include more exposure to banks, healthcare, industrials, luxury goods, energy, and consumer staples. For a beginner, the practical answer is usually not “U.S. or Europe?” but “How much of each fits my portfolio?”
Think of U.S. stocks as a growth-heavy engine and European stocks as a value-and-income-heavy stabilizer. The U.S. market may lead when investors reward innovation, software, AI, and high earnings growth. Europe may look attractive when valuations matter more, dividends matter more, the euro strengthens, or global investors rotate away from expensive mega-cap technology stocks.
2. U.S. stocks vs European stocks at a glance
| Feature | U.S. stocks | European stocks | Why beginners should care |
|---|---|---|---|
| Common benchmark | S&P 500 or MSCI USA | STOXX Europe 600 or MSCI Europe | Your ETF usually tracks one of these indexes. |
| Market style | Growth-heavy, tech-heavy, mega-cap-heavy | More value, dividend, industrial, financial, healthcare, luxury, and energy exposure | Different sectors perform well in different economic conditions. |
| Currency for U.S. investor | Usually USD | Usually EUR, GBP, CHF, DKK, SEK and others | Currency movement can help or hurt returns. |
| Dividend profile | Lower average dividend yield | Higher average dividend yield | Income-focused investors often compare payout reliability and withholding tax. |
| Valuation profile | Often more expensive by P/E and price/book | Often cheaper by P/E and price/book | Cheaper is not automatically better, but valuation affects future return expectations. |
| Concentration risk | Top tech companies can dominate index returns | More spread across countries and sectors | Diversification can reduce reliance on a few companies. |
| Main beginner route | U.S. index fund or ETF | Europe ETF or international ETF | Most beginners use broad, low-cost ETFs instead of picking stocks. |
3. What are U.S. stocks?
U.S. stocks are shares of publicly traded companies listed mainly on American exchanges such as the New York Stock Exchange and Nasdaq. When people say “the U.S. stock market,” they often mean the S&P 500, the Nasdaq Composite, the Dow Jones Industrial Average, or a broad index such as MSCI USA.
The MSCI USA Index is a useful broad benchmark because it measures large- and mid-cap U.S. companies and covers about 85% of the free-float-adjusted market capitalization of the U.S. market. As of May 29, 2026, MSCI listed 536 constituents, a dividend yield of 1.11%, a trailing P/E of 28.27, and a forward P/E of 21.72 for MSCI USA. [Source: MSCI USA Index profile and factsheet]
3.1 In simple words
Buying U.S. stocks means buying a slice of companies that earn money from areas such as cloud computing, smartphones, advertising, chips, healthcare, retail, finance, manufacturing, and consumer brands. Many of these companies operate worldwide, so a U.S. stock fund is not purely domestic exposure. A company may be listed in the U.S. but sell products globally.
4. What are European stocks?
European stocks are shares of companies listed across developed European markets such as the United Kingdom, France, Germany, Switzerland, the Netherlands, Spain, Sweden, Italy, Denmark, and others. Investors commonly track them through the STOXX Europe 600, MSCI Europe, FTSE Developed Europe, or country indexes such as the DAX, CAC 40, FTSE 100, and Swiss Market Index.
The MSCI Europe Index captures large- and mid-cap companies across developed European markets and covers about 85% of the free-float-adjusted market capitalization in the European developed-market equity universe. As of May 29, 2026, MSCI listed 403 constituents, a dividend yield of 2.89%, a trailing P/E of 17.49, and a forward P/E of 14.77 for MSCI Europe. [Source: MSCI Europe Index profile]
The STOXX Europe 600 is another major benchmark. STOXX describes it as a broad European equity-market measure with 600 components across 17 countries and 11 industries, representing nearly 90% of the underlying investable market. [Source: STOXX Europe 600 profile]
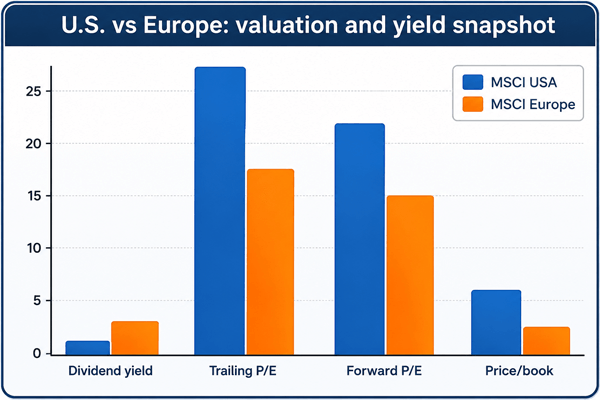
Figure 1. Valuation and yield comparison using MSCI profile data as of May 29, 2026. Lower valuation ratios do not guarantee higher future returns, but they show how differently the two regions are priced.
5. The biggest differences between U.S. and European stocks
5.1 Sector mix: the U.S. is more technology-driven
The U.S. market is heavily influenced by large technology and communication-platform companies. That can be powerful in bull markets because fast-growing companies can compound earnings quickly. It also creates concentration risk: if a handful of mega-cap companies disappoint, the whole index can feel it.
Europe has world-class technology companies too, but the overall market is less dominated by software platforms and U.S.-style mega-cap tech. Europe tends to have heavier exposure to financials, industrials, healthcare, energy, consumer staples, luxury goods, and global exporters. This can make European stocks behave differently from U.S. stocks.
5.2 Valuation: Europe is often cheaper, but cheap has reasons
European stocks frequently trade at lower P/E ratios than U.S. stocks. Beginners sometimes see that and assume Europe must be the better deal. Not always. A lower valuation can mean the market expects slower growth, lower margins, more regulation, weaker demographics, or less investor excitement. Still, when the gap becomes very wide, Europe can attract investors looking for value, dividends, and diversification.
5.3 Dividends: Europe often pays more income
European indexes usually have higher dividend yields than U.S. indexes. That can appeal to income investors, retirees, and people who want a cash-return component. But dividends are not free money. A stock price adjusts when dividends are paid, companies can cut dividends, and foreign dividend withholding taxes may reduce what investors actually keep.
5.4 Currency: European returns depend partly on exchange rates
A U.S.-based investor buying European stocks is not only investing in European companies. They are also taking currency exposure. If European stocks rise 8% in local currency but the euro weakens sharply against the dollar, a U.S. investor may receive a much lower dollar return. If the euro strengthens, currency can add to returns. Currency-hedged ETFs can reduce this effect, but hedging has costs and may not always help.
5.5 Economic backdrop: one country vs many countries
The U.S. market is tied to one large economy, one federal government, one central bank, and one main currency. Europe is more complex: many countries, languages, political systems, fiscal policies, tax regimes, and currencies. Even inside the euro area, companies operate under different national rules and economic conditions. This makes Europe more diversified, but also harder to understand.
5.6 Corporate culture: buybacks vs dividends
U.S. companies often return cash through share buybacks as well as dividends. European companies often place more emphasis on dividends. This difference matters for investors comparing income. A U.S. stock with a low dividend yield may still be returning capital through buybacks, while a European stock may provide more visible cash income.
6. Performance compared: why the results often look different
Over the last decade, U.S. stocks have generally outperformed European stocks. The main reasons were stronger earnings growth from U.S. mega-cap technology companies, deeper capital markets, higher profit margins, a stronger innovation cycle, and investor willingness to pay higher valuations for growth.
But performance leadership changes over time. Europe can outperform when valuations reset, the dollar weakens, European banks and industrials benefit from the economic cycle, energy and materials do well, or global investors rotate from growth into value. A smart comparison should not only ask “Who won recently?” It should ask “What caused the win, and can that reason continue?”
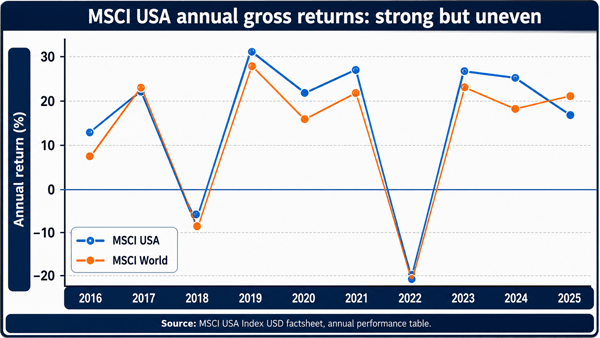
Figure 2. MSCI USA annual gross returns show that even a strong market can have negative years. This is why long-term investors avoid assuming recent returns will continue in a straight line.
| Metric / fact | MSCI USA | MSCI Europe | Practical meaning |
|---|---|---|---|
| Constituents | 536 | 403 | Both are broad, but the U.S. benchmark is much larger by market value. |
| Index market cap | $65.85 trillion | $14.26 trillion | The U.S. equity market is far larger and more dominant in global portfolios. |
| Dividend yield | 1.11% | 2.89% | Europe may provide more visible income, before taxes and currency effects. |
| Trailing P/E | 28.27 | 17.49 | U.S. stocks were priced at a higher earnings multiple. |
| Forward P/E | 21.72 | 14.77 | Investors were paying more for expected U.S. earnings. |
| Price/book | 5.86 | 2.46 | The U.S. market had a much higher valuation relative to book value. |
| Largest constituent market cap | $5.13 trillion | $627.24 billion | U.S. index concentration in mega-caps is much more extreme. |
Source note: Table uses MSCI USA and MSCI Europe profile data as of May 29, 2026. Figures change over time.
7. Beginner example: how returns can differ
Imagine two investors each put $10,000 into a broad stock ETF at the start of a year.
| Scenario | U.S. stock ETF | Europe stock ETF | What the beginner learns |
|---|---|---|---|
| Growth-led year | U.S. ETF gains 18% because mega-cap tech earnings are strong. | $10,000 becomes $11,800. Europe gains 8%, so $10,000 becomes $10,800. | U.S. leadership often comes from fast-growing sectors. |
| Value rotation year | U.S. ETF gains 4%. Europe gains 14% because banks, industrials, and cheaper stocks rerate. | The Europe investor wins that year. | Cheaper markets can outperform when sentiment changes. |
| Currency impact year | Europe rises 10% locally, but the euro falls 6% against the dollar. | A U.S. investor may see only about 4% before fees/taxes. | Foreign-stock returns include currency effects. |
| Bear market year | U.S. falls 20%. Europe falls 16%. | Both lose money. | Diversification helps, but it does not eliminate stock-market risk. |
8. How beginners can invest in U.S. and European stocks
8.1 Use broad ETFs or index funds before individual stocks
For most beginners, a broad, low-cost ETF is simpler than picking individual stocks. A U.S. ETF might track the S&P 500, total U.S. market, or MSCI USA. A European ETF might track MSCI Europe, STOXX Europe 600, FTSE Developed Europe, or a Europe ex-UK index.
8.2 Decide whether you want Europe only or total international exposure
Europe is only one part of international investing. A total international fund usually includes Europe, Japan, Canada, Australia, and emerging markets. A Europe-only ETF is more focused and can be useful if you specifically want to tilt toward European valuations, dividends, or sectors.
8.3 Watch fees, spreads, taxes, and fund domicile
Expense ratio matters, but it is not the only cost. Beginners should also check trading spreads, whether the ETF is accumulating or distributing dividends, withholding taxes, account type, and whether the fund is suitable for their country. For non-U.S. investors, U.S.-domiciled ETFs may create different tax and estate considerations than Ireland- or Luxembourg-domiciled UCITS ETFs.
8.4 Rebalance instead of chasing last year’s winner
A common mistake is buying whichever region just performed best. A more disciplined approach is to choose a target allocation, then rebalance periodically. If U.S. stocks run far ahead, rebalancing may add to Europe. If Europe outperforms, rebalancing may add to the U.S. This turns diversification into a process rather than a guess.
9. Sample portfolio approaches
These are educational examples, not recommendations. The right mix depends on the investor’s age, goals, risk tolerance, time horizon, taxes, income needs, and home country.
| Investor type | Possible stock allocation idea | Why it may fit | Main risk |
|---|---|---|---|
| Simple global beginner | One global stock ETF | Automatically includes U.S., Europe, and other developed/emerging markets. | Less control over regional tilts. |
| U.S.-focused investor | 70-90% U.S. stocks, 10-30% international stocks | Keeps home-market familiarity while adding diversification. | Still heavily dependent on U.S. valuations and currency. |
| Balanced global investor | About 60% U.S., 25% Europe/developed ex-U.S., 15% emerging/other | More regionally diversified than a U.S.-only portfolio. | May lag U.S.-only portfolios during U.S. tech-led rallies. |
| Income-oriented investor | U.S. broad ETF plus dividend-focused Europe/international ETF | Adds exposure to higher-yielding regions. | Dividend cuts, tax drag, and currency swings. |
| Tactical value investor | Core global ETF plus small Europe overweight | Uses Europe’s lower valuation as a measured tilt. | Value can stay cheap for years. |
Vanguard’s public investor education material says investors should generally consider at least 20% international exposure in stocks and bonds, and that full diversification benefits may mean around 40% of stock allocation in international stocks. This is a useful reference point, not a rule for every investor. [Source: Vanguard international investing education]
10. When U.S. stocks may be more attractive
- You want exposure to the world’s deepest capital market and many of the largest technology, AI, software, cloud, semiconductor, and platform businesses.
- You prefer a single-currency USD exposure and want to reduce foreign-currency complexity.
- You believe U.S. corporate earnings growth can keep justifying higher valuations.
- You use a simple S&P 500 or total U.S. market ETF as a core holding.
- You accept that a few mega-cap companies may drive a large part of your result.
11. When European stocks may be more attractive
- You want lower valuations and higher dividend yields than the U.S. market currently offers.
- You want exposure to global leaders in luxury goods, industrial automation, pharmaceuticals, banking, energy, consumer staples, and engineering.
- You want diversification away from U.S. mega-cap technology concentration.
- You believe the euro, pound, or Swiss franc may strengthen versus your home currency.
- You are willing to accept slower growth, political complexity, and currency/tax issues in exchange for diversification.
12. Common mistakes beginners make
12.1 comparing only price returns
Some markets pay higher dividends than others. If you compare only index price movement, you may understate the return from dividend-heavy markets. Use total return data when possible.
12.2 ignoring currency
A European ETF can be up in euros but flat in dollars. Always check whether your return is shown in local currency, USD, hedged, unhedged, gross return, net return, or price return.
12.3 thinking “cheap” means “safe”
Low P/E stocks can keep falling if earnings decline. A cheap market can stay cheap. Valuation is important, but it is not a timing tool by itself.
12.4 buying overlapping funds
Many global ETFs already include U.S. and European stocks. If you add a U.S. ETF and a Europe ETF on top of a global ETF, you may create unintended overweight positions.
12.5 taking tax advice from social media
Cross-border investing can involve dividend withholding taxes, estate taxes, tax treaties, account rules, and fund domicile issues. This is where investors should verify details with reliable tax resources or a qualified professional in their jurisdiction.
13. Practical checklist before buying a U.S. or European stock ETF
| Question | Why it matters |
|---|---|
| What index does the ETF track? | S&P 500, MSCI USA, MSCI Europe, and STOXX Europe 600 do not hold the same companies. |
| What is the expense ratio? | Lower fees leave more return for the investor over time. |
| Is it accumulating or distributing dividends? | Affects income, reinvestment, and tax reporting. |
| What currency is the fund traded in? | Trading currency is not always the same as underlying currency exposure. |
| Is it currency hedged? | Hedging can reduce currency volatility but may add cost and behave differently across interest-rate environments. |
| How concentrated are the top holdings? | A “broad” ETF can still be heavily influenced by a few companies. |
| What are the tax consequences? | Withholding tax and domicile can materially affect after-tax returns. |
| How will it fit with my existing funds? | Avoid accidental duplication and overconcentration. |
14. People-experience insights: what investors usually notice in real life
Investors who hold only U.S. stocks often feel smart during long U.S. bull markets, especially when technology stocks lead. The problem appears later: if the U.S. market becomes expensive or a few mega-cap names pull back, the portfolio may be less diversified than it looked.
Investors who add Europe often notice three things. First, the portfolio may feel less exciting because Europe can lag during tech-led rallies. Second, dividends may feel more visible, especially in distributing funds. Third, currency movement can be confusing because the ETF’s local-market result and the investor’s home-currency result can differ.
Experienced investors usually stop asking which region will win every year. They focus on building a structure they can stick with. The best allocation is often the one the investor can hold through both U.S.-led and Europe-led cycles without panic selling.
15. Bottom line
U.S. stocks and European stocks are not substitutes that behave the same way. U.S. stocks are generally larger, more growth-oriented, more technology-heavy, and more expensive by common valuation measures. European stocks are generally more income-oriented, cheaper by common valuation measures, and more diversified across countries, currencies, and traditional sectors.
For beginners, the most practical route is usually to start with broad, low-cost index funds, understand what each fund owns, keep costs and taxes low, diversify globally, and avoid chasing whichever region performed best recently. U.S. stocks can be the growth core of a portfolio. European stocks can add valuation, dividend, sector, and currency diversification. Used together carefully, they can make a portfolio more balanced than either region alone.
16. FAQ: U.S. stocks vs European stocks
16.1 Are U.S. stocks better than European stocks?
Not always. U.S. stocks have often performed better in recent years, but that does not mean they will always outperform. Europe can outperform when valuations, dividends, currency, banks, industrials, or value stocks come back into favor.
16.2 Are European stocks safer than U.S. stocks?
No stock market is automatically safe. European indexes may be less concentrated in mega-cap technology, but they still carry equity risk, currency risk, economic risk, and political risk.
16.3 Why do European stocks have higher dividends?
Many European companies have a stronger dividend culture and operate in mature sectors that return more cash to shareholders. But dividends can be reduced, and foreign withholding tax can lower the amount investors keep.
16.4 Should beginners buy individual European stocks?
Most beginners are better served by broad ETFs first. Individual stocks require company research, accounting knowledge, currency awareness, and country-specific tax understanding.
16.5 What is the simplest way to invest in both regions?
A broad global equity ETF is the simplest route because it includes U.S., European, and other international stocks in one fund. Investors who want more control can combine a U.S. ETF with a Europe or total international ETF.
16.6 Does an S&P 500 ETF already include Europe?
An S&P 500 ETF holds U.S.-listed companies only, but many of those companies earn revenue globally, including from Europe. That is global revenue exposure, not the same as owning European-listed companies.
Sources Consulted and Checked
The following official and reputable sources were consulted and checked while preparing this article and verifying its factual accuracy.
- MSCI USA Index profile and factsheet, data as of May 29, 2026: index coverage, constituents, valuation, yield, annual performance, and risk metrics.
- MSCI Europe Index profile, data as of May 29, 2026: index coverage, constituents, valuation, yield, and top holdings.
- STOXX Europe 600 official profile: benchmark description, 600 components, 17 countries, 11 industries, and nearly 90% investable-market coverage.
- Vanguard investor education: international diversification discussion and general international allocation reference points.
- https://www.msci.com/indexes/index/984000/msci-usa-index
- https://www.msci.com/indexes/index/990500/msci-europe-index
- https://stoxx.com/index/sxxgr/
- https://investor.vanguard.com/investor-resources-education/understanding-investment-types/why-invest-internationally
Reader Advice
This article is provided solely for educational and informational purposes and does not constitute personal financial, investment, tax, legal, or other professional advice. Stock prices can fall, currencies can move, dividends can be reduced, taxes and costs can materially affect returns, and past performance does not guarantee future results. Before making any investment or financial decision, readers should consider their own goals, risk tolerance, time horizon, financial circumstances, costs, tax position, and jurisdiction, and should seek advice from an appropriately qualified professional where necessary.
Market data, valuations, fund features, tax rules, regulations, index compositions, and other facts may change over time or differ by country, provider, account type, and investor circumstances. Readers should therefore verify all current facts, figures, eligibility requirements, product documents, and applicable rules directly from official and authoritative sources before acting.