U.S. Stocks vs Asian Stocks: Growth Potential and Investment Opportunities
1. Quick answer: which market looks more attractive?
For many long-term investors, U.S. stocks remain the core holding because the U.S. market has deep liquidity, strong global companies, and easier access through low-cost index funds. However, Asian stocks deserve serious attention because several Asian markets are tied to structural growth themes: AI hardware, semiconductors, electric vehicles, digital payments, domestic consumption, banking penetration, supply-chain relocation, and corporate reforms.
The honest answer is not “choose one.” A beginner is usually better served by understanding the role each region can play. U.S. stocks can be the foundation. Asian stocks can be the growth diversifier. The blend may be more resilient than betting everything on one market.
2. What are U.S. stocks and Asian stocks?
A stock is a small ownership share in a company. When you buy a stock, you are not just buying a ticker symbol on a screen. You are buying a claim on a company’s future profits, cash flows, assets, and business performance. If the company grows its earnings and investors are willing to pay a fair or higher price for those earnings, the stock can rise. If the company disappoints, the stock can fall.
U.S. stocks usually refer to companies listed in the United States, such as businesses in technology, healthcare, finance, consumer goods, energy, and industrials. The common benchmark is the S&P 500, which tracks 500 large U.S. companies, or broader indexes such as MSCI USA, which includes large and mid-cap U.S. stocks.
Asian stocks refer to companies listed across Asia. This can include developed markets such as Japan, Singapore, Hong Kong and South Korea, and emerging markets such as China, India, Taiwan, Indonesia, Thailand, Malaysia, the Philippines and Vietnam. Some Asian indexes include Japan, while others exclude it. This difference matters because Japan can significantly change the sector mix, currency exposure, valuation, and performance profile.
3. How stock market investing works in plain English
Stock prices move because investors constantly update what they believe a company is worth. They look at earnings, revenue growth, interest rates, inflation, industry trends, management quality, political risk, currency movements, and the price they must pay today. In simple words: a good company can still be a bad investment if you overpay, and an average company can sometimes be a good investment if the price is low enough and the business improves.
For beginners, the most useful idea is this: your return usually comes from three places.
- Earnings growth: the company makes more profit over time.
- Dividends: the company pays part of its profit to shareholders.
- Valuation change: investors become willing to pay a higher or lower multiple for the same earnings.
This is why comparing the U.S. and Asia is not only about “which market is growing faster.” It is also about how much you are paying for that growth, how reliable the companies are, and how much risk you can emotionally and financially handle.
4. Current valuation and income comparison
Valuation is the price investors pay for a company’s earnings or assets. It is not a perfect timing tool, but it helps you avoid blind enthusiasm. A market with a high P/E ratio can still rise if earnings grow strongly, but the margin of safety is usually thinner. A market with a lower valuation can still fall if earnings decline or investors lose confidence.
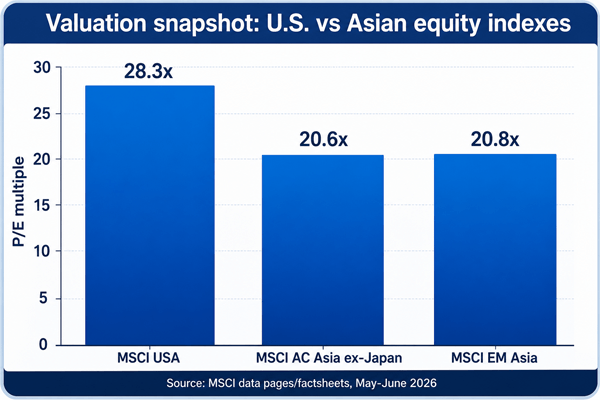
Figure 2: Valuation snapshot using MSCI index data. P/E is a rough measure of how much investors pay for one dollar of earnings.
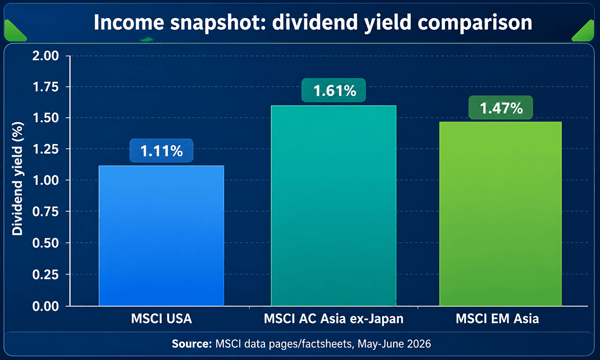
Figure 3: Dividend yield snapshot. Higher yield can help total return, but yield alone should never be the only reason to invest.
| Index | P/E | Forward P/E | P/BV | Dividend yield | Practical interpretation |
|---|---|---|---|---|---|
| MSCI USA | 28.27 | N/A on selected page | N/A on selected page | 1.11% | Broad U.S. large and mid-cap equity exposure. |
| MSCI AC Asia ex-Japan | 20.55 | 12.88 | 2.60 | 1.61% | Asia exposure excluding Japan; includes a mix of developed and emerging Asian markets. |
| MSCI Emerging Markets Asia | 20.83 | 12.73 | 2.73 | 1.47% | Emerging Asian markets with heavier exposure to China, India, Taiwan, South Korea and related growth themes. |
5. Growth potential: where the opportunity may come from
Growth potential means the realistic chance that corporate earnings, dividends, and investor demand can increase over time. It does not mean a market will go up every year. Both U.S. and Asian stocks can have painful drawdowns. The better question is: what forces can support earnings over the next five to ten years?
5.1 Why U.S. stocks may keep attracting investors
- World-class technology and software companies: The U.S. remains home to many of the world’s most profitable platform businesses in cloud computing, artificial intelligence, digital advertising, cybersecurity, payments, enterprise software and semiconductors.
- Deep capital markets: U.S. companies generally have easier access to equity and debt markets, which can support innovation and acquisitions.
- High transparency and analyst coverage: Beginners often find it easier to research U.S. companies because reporting standards, investor presentations, and financial data are widely available.
- Global revenue base: Many U.S. companies earn money around the world, so buying U.S. stocks can still give indirect exposure to international growth.
- Strong index fund ecosystem: Low-cost S&P 500 and total U.S. market ETFs make it simple to build broad exposure.
The main concern is valuation. When a market trades at a high earnings multiple, future returns depend more heavily on companies delivering strong profit growth. If earnings disappoint or interest rates rise, high-valuation stocks can fall quickly.
5.2 Why Asian stocks may offer attractive opportunities
- AI and semiconductor supply chains: Taiwan and South Korea are important parts of the global chip and memory ecosystem. Many Asian companies supply the hardware behind cloud computing and AI growth.
- Domestic consumption: India, Indonesia, Vietnam and parts of Southeast Asia have large young populations, rising incomes, and expanding middle classes.
- Manufacturing relocation: As companies diversify supply chains beyond one country, markets such as India, Vietnam, Malaysia, Thailand and Indonesia may benefit over time.
- Financial deepening: Banking, insurance, asset management and digital payments can grow as household income and formal financial access improve.
- Corporate reform: Japan and South Korea have both seen investor interest linked to governance improvement, higher dividends, buybacks and better capital discipline.
- Valuation gaps: Some Asian markets trade below U.S. valuations, which can create opportunity if earnings improve and investor confidence returns.
The main concern is risk. Asian markets are not one single market. China risk is different from India risk. Taiwan risk is different from Indonesia risk. Currency movements, regulation, geopolitics, capital controls, accounting quality and liquidity can all affect returns. Beginners should avoid treating “Asia” as one simple trade.
6. U.S. stocks vs Asian stocks: practical comparison table
| Factor | U.S. stocks | Asian stocks |
|---|---|---|
| Return drivers | Earnings from technology, healthcare, financials, consumer brands, buybacks, productivity, AI software and infrastructure. | Earnings from semiconductors, manufacturing, domestic demand, financial inclusion, exports, infrastructure and reforms. |
| Valuation profile | Often more expensive, especially when mega-cap technology leads the market. | Mixed: some markets expensive because of growth, others cheaper due to risk or weak sentiment. |
| Currency exposure | Mostly U.S. dollar for U.S.-based investors; foreign investors face USD exchange-rate risk. | Multiple currencies: yen, yuan, rupee, won, Taiwan dollar, Singapore dollar, rupiah and others. |
| Liquidity | Very high liquidity, tight spreads, many ETFs and options. | High in Japan, Hong Kong, India, Taiwan and South Korea; lower in smaller ASEAN markets. |
| Information quality | Generally strong disclosure and wide analyst coverage. | Varies by country; large companies are easier to research than small local firms. |
| Risk level | Market risk, valuation risk, sector concentration, interest-rate risk. | Market risk plus currency, governance, political, regulatory and geopolitical risk. |
| Best fit | Core long-term holdings, retirement investing, simple index strategy. | Diversification, growth satellite, thematic exposure, valuation opportunity. |
7. What beginners should know before investing
Many beginners start by asking, “Which stocks should I buy?” A better first question is, “What kind of portfolio can I hold through bad months without panicking?” The best investment plan is not the most exciting one. It is the one you can actually follow.
7.1 Know the difference between an index, ETF and individual stock
| Term | Plain meaning | Why it matters |
|---|---|---|
| Individual stock | A share of one company. | Highest company-specific risk. Can outperform, but one mistake can hurt badly. |
| Index | A basket that tracks a market, such as the S&P 500 or MSCI Emerging Markets Asia. | You cannot usually buy an index directly; you buy a fund that tracks it. |
| ETF | An exchange-traded fund that holds many stocks and trades like a stock. | Beginner-friendly because it gives instant diversification at low cost. |
| Mutual fund | A pooled investment fund bought through a fund company or platform. | Useful for retirement accounts or automatic investing, but fees vary. |
7.2 Understand risk before chasing returns
Risk is not just volatility on a chart. Risk is needing your money during a market crash, investing in something you do not understand, paying too much in fees, owning too much of one country, or selling because headlines become scary. A beginner should assume that any stock market investment can fall 20%, 30% or more at some point.
7.3 Time horizon matters more than daily news
Money needed in the next one to three years should usually not be heavily exposed to stocks. Stocks are better suited for long-term goals such as retirement, wealth building, children’s education, or financial independence. The longer your time horizon, the more time you have for earnings growth and compounding to work.
7.4 Fees are one of the few things you can control
A fund charging 0.05% per year and a fund charging 1.00% per year may look similar at first, but over decades the difference can be meaningful. Beginners should compare expense ratios, trading commissions, bid-ask spreads, taxes, currency conversion costs and platform fees.
7.5 Currency can help or hurt returns
If you live outside the U.S. and invest in U.S. stocks, your return depends partly on the U.S. dollar. If you invest in Asian stocks, your return can depend on several Asian currencies. Sometimes the stock market rises but currency weakness reduces your return in your home currency. This is normal and should be part of your plan.
8. How beginners can use U.S. and Asian stocks in a portfolio
There is no perfect allocation for everyone, but beginners can use simple frameworks. The goal is to build exposure without overcomplicating the portfolio.
| Investor type | Example structure | Who it may fit |
|---|---|---|
| Conservative beginner | 70-80% broad U.S./global developed market equity ETF, 10-20% broad Asia or emerging market ETF, rest in bonds/cash depending on goals. | Someone who wants growth but does not want large regional surprises. |
| Balanced global investor | 50-60% U.S. equity ETF, 20-30% developed international ETF, 10-20% Asia or emerging Asia ETF, bonds/cash as needed. | Someone who wants global diversification and can handle volatility. |
| Growth-oriented investor | 40-50% U.S. equity ETF, 25-35% Asia/emerging markets ETF, 10-20% thematic or quality funds, bonds/cash as needed. | Someone with a long horizon and higher risk tolerance. |
| Active stock picker | Core ETFs for 70-90% of the equity portfolio, individual U.S. or Asian stocks limited to a smaller satellite sleeve. | Someone who wants to research companies but avoid putting the whole portfolio at risk. |
These example structures illustrate how regional exposure can be combined. The appropriate mix depends on age, income stability, debts, emergency savings, tax situation, country of residence, time horizon, and tolerance for losses.
9. Step-by-step investing process for beginners
- Build an emergency fund first. Do not invest money you may need for rent, medical costs or short-term obligations.
- Choose your account type. This may be a brokerage account, retirement account, tax-advantaged account, or local investment platform depending on your country.
- Pick broad funds before individual stocks. Start with diversified ETFs or index funds covering the U.S., global developed markets, and Asian or emerging markets.
- Decide your allocation in writing. For example: 60% U.S., 25% international developed, 15% Asia/emerging markets.
- Invest gradually if you are nervous. Dollar-cost averaging can reduce regret, although lump-sum investing can work better statistically when markets rise.
- Rebalance once or twice a year. If Asia rises sharply and becomes too large, trim it back. If it falls but your thesis remains valid, rebalancing may make you buy low.
- Review fees and taxes annually. A good portfolio can be damaged by high fees, unnecessary trading and tax mistakes.
- Ignore hot tips. If a stock idea cannot be explained clearly in one paragraph, you probably do not understand it well enough yet.
10. Practical example: comparing two beginner portfolios
Imagine two beginners, Sara and Ali. Both have a 10-year horizon and want stock market exposure. Sara puts all her money into a U.S. technology-heavy fund because recent returns look strong. Ali uses a broader plan: 60% U.S. equity ETF, 25% broad international ETF, and 15% emerging Asia ETF.
If U.S. mega-cap technology keeps leading, Sara may outperform. But if U.S. valuations compress or leadership rotates to cheaper international markets, Ali may have a smoother experience. Ali’s plan does not require predicting the winning region every year. It accepts uncertainty and spreads the risk.
| Portfolio style | Pros | Cons | Better suited for |
|---|---|---|---|
| All-in U.S. growth approach | Simple, strong exposure to leading U.S. companies, easy to track. | High concentration, valuation risk, painful if U.S. tech underperforms. | Experienced investors with strong conviction and high risk tolerance. |
| Diversified U.S. + Asia approach | More balanced, captures U.S. quality and Asian growth, less dependent on one market. | May lag when one region dominates; more currency and international complexity. | Beginners and long-term investors who prefer resilience over excitement. |
11. Where Asian opportunities are most focused
Asia is too large to analyze as one block. A useful beginner framework is to separate the region into opportunity buckets.
| Market | Common opportunity areas | Growth drivers | Main risks |
|---|---|---|---|
| Taiwan | Semiconductors, AI hardware, electronics supply chains. | Global chip demand, AI servers, advanced manufacturing. | Geopolitical tension, export cycles, customer concentration. |
| South Korea | Memory chips, batteries, autos, industrials, corporate reform. | AI memory demand, valuation re-rating, shareholder return improvements. | Cyclical earnings, won currency risk, chaebol governance issues. |
| India | Banks, consumer, IT services, infrastructure, digital economy. | Young population, domestic demand, formalization, supply-chain diversification. | Higher valuations, execution risk, policy changes. |
| China/Hong Kong | Internet platforms, electric vehicles, manufacturing, consumption. | Low valuations in some sectors, policy support, huge domestic market. | Regulatory risk, property sector weakness, geopolitics. |
| Japan | Automation, industrials, financials, exporters, corporate reform. | Governance reforms, shareholder returns, inflation normalization. | Currency volatility, aging population, export sensitivity. |
| ASEAN | Banks, telecoms, consumer, resources, tourism, manufacturing. | Rising middle class, supply-chain relocation, infrastructure growth. | Liquidity, politics, commodity cycles, currency risk. |
12. Common mistakes beginners make
- Buying only because a market recently went up. Past performance can attract attention, but future returns depend on future earnings and valuations.
- Confusing a good economy with a good stock market. A fast-growing economy can still produce poor stock returns if valuations are too high or profits do not reach shareholders.
- Owning too many overlapping ETFs. Many global funds already hold U.S. mega-cap stocks, so adding more U.S. tech funds may increase concentration without realizing it.
- Ignoring taxes. Dividends, capital gains, withholding taxes and account type can change your real return.
- Trading too often. Frequent trading usually increases costs and emotional mistakes.
- Putting too much into a single country because of a headline. Country-specific ETFs can be useful, but they are more volatile than broad regional funds.
- Taking social media stock tips as research. Real research includes business model, valuation, balance sheet, risks, competition and position sizing.
13. How to research a U.S. or Asian stock like an analyst
If you decide to buy individual stocks, use a checklist. This keeps you from falling in love with a story before checking the numbers.
| Research area | Beginner question |
|---|---|
| Business model | How does the company make money? Is revenue recurring or cyclical? |
| Growth | Are sales and earnings growing because of real demand, price increases, acquisitions or one-time factors? |
| Profitability | Does the company have healthy margins, return on equity and free cash flow? |
| Balance sheet | Is debt manageable? Can the company survive a bad cycle? |
| Valuation | Is the P/E, price-to-sales, EV/EBITDA or price-to-book reasonable compared with growth and peers? |
| Management | Does management allocate capital well? Are there buybacks, dividends or value-destructive acquisitions? |
| Risks | What could go wrong: regulation, currency, competition, political risk, customer concentration? |
| Position size | How much can you lose without damaging your plan? |
14. Investment vehicles: easiest ways to get exposure
| Vehicle | What it gives you | Pros | Watch-outs |
|---|---|---|---|
| S&P 500 ETF | Broad exposure to large U.S. companies. | Low cost, simple, liquid. | Still U.S.-heavy and often tech-heavy. |
| Total U.S. market ETF | Large, mid and small-cap U.S. stocks. | Broader than the S&P 500. | Still tied to U.S. valuations and dollar. |
| MSCI USA ETF | Large and mid-cap U.S. exposure. | Useful for global investors using MSCI benchmarks. | Similar concentration issues as U.S. market-cap indexes. |
| MSCI AC Asia ex-Japan ETF | Asian markets excluding Japan. | Focused Asia exposure without Japan dominating the allocation. | China, Taiwan, India and Korea weights can drive returns. |
| Emerging Markets Asia ETF | Emerging Asian markets. | Higher growth potential and regional diversification. | Higher volatility, currency and political risks. |
| Country-specific ETF | Single country such as India, China, Taiwan, South Korea or Japan. | Useful for targeted views. | Higher risk; not ideal as a beginner’s main holding. |
15. Responsible risk management
Responsible investing requires avoiding hype, unrealistic promises, and “guaranteed return” claims. Stock investing always involves risk, so both potential benefits and possible losses should be considered clearly.
- Do not expect or rely on fixed returns from stocks. Markets do not work that way.
- Treat all forecasts as uncertain. Terms such as “may,” “can,” and “potential” reflect that investment outcomes cannot be guaranteed.
- Distinguish general education from personal advice. The best choice depends on each investor’s financial circumstances.
- Prioritize diversification, cost awareness, emergency savings, and long-term thinking.
- Verify current data before investing because valuations, yields, rules, taxes, and market conditions can change frequently.
- Consider consulting a qualified financial adviser for tax, retirement, cross-border, or major investment decisions.
16. U.S. stocks vs Asian stocks: which is better for different goals?
| Goal | Possible approach | Why |
|---|---|---|
| Long-term retirement growth | U.S. broad market ETF as a core, plus global diversification. | U.S. market has depth, quality and long-term compounding history. |
| Higher growth potential | Add diversified Asia or emerging Asia exposure. | Asia offers structural growth but with higher volatility. |
| Income/dividends | Compare dividend-focused U.S., Asia and global funds. | Dividend yield varies; quality and sustainability matter more than headline yield. |
| Lower complexity | Use one global equity ETF or a simple two-fund portfolio. | The easiest portfolio to hold is often better than the perfect portfolio you abandon. |
| Thematic AI exposure | Blend U.S. technology with Asian semiconductor supply-chain exposure. | AI winners may be spread across software, chips, memory, manufacturing and power infrastructure. |
| Currency diversification | Own funds with exposure outside your home currency. | Currency can reduce or increase returns, so diversify rather than make big currency bets. |
17. A simple beginner allocation example
Here is a practical example for a beginner with a long-term horizon who wants growth but does not want to bet everything on one region:
| Weight | Holding type | Purpose |
|---|---|---|
| 60% | Broad U.S. equity ETF | Core exposure to large, profitable U.S. companies and global innovators. |
| 25% | Developed international or global ex-U.S. ETF | Adds Europe, Japan and other developed markets to reduce U.S.-only concentration. |
| 15% | Asia or emerging Asia ETF | Adds exposure to Asian growth themes such as semiconductors, domestic demand and manufacturing. |
A more conservative investor might reduce Asia exposure. A more aggressive investor might increase it, but only after accepting higher volatility. The key is not the exact percentage. The key is having a written reason for every holding.
18. What to watch in 2026 and beyond
- U.S. earnings concentration: If a small group of mega-cap technology companies drives most market earnings growth, broad index investors should understand that concentration.
- AI capital spending: U.S. software and cloud companies may benefit, while Asian hardware and semiconductor firms may also participate in the AI buildout.
- Interest rates: Lower rates can support valuations; higher rates can pressure expensive growth stocks.
- China policy and property risks: Policy support can improve sentiment, but property weakness and regulation remain important risks.
- India valuations: India has strong long-term growth potential, but investors should be careful when expectations and valuations are already high.
- Japan and Korea reforms: Corporate governance, dividends and buybacks can affect how much profit reaches shareholders.
- Currency trends: Dollar strength or weakness can change returns for international investors.
- Geopolitics: Taiwan Strait tensions, trade policy, tariffs, export controls and regional conflicts can affect Asian and U.S. stocks.
19. Frequently asked questions
19.1 Are Asian stocks riskier than U.S. stocks?
Generally, broad Asian and emerging Asian stocks can be more volatile because they include more currency, political, regulatory and country-specific risks. However, risk varies by market and company. A large Japanese industrial company is very different from a small-cap frontier-market stock.
19.2 Can beginners invest in Asian stocks?
Yes, but the easiest route is usually a diversified ETF rather than individual foreign stocks. A broad Asia or emerging markets ETF reduces the risk of choosing one wrong company or country.
19.3 Should I invest only in the S&P 500?
The S&P 500 is a strong core holding for many investors, but it is still one country and often concentrated in a few large sectors. Adding international exposure may improve diversification.
19.4 Is Asia better for growth?
Asia has strong growth areas, but growth does not automatically mean higher stock returns. You must consider valuation, governance, currency and whether profits actually benefit shareholders.
19.5 What is the safest way to compare markets?
Compare earnings growth, valuation, dividend yield, sector exposure, currency risk, political risk, fees and your own time horizon. Do not compare only recent performance.
19.6 How often should I rebalance?
For most beginners, once or twice a year is enough. Rebalancing too often can create costs and taxes, while never rebalancing can let one region dominate your risk.
19.7 Do I need a financial adviser?
For basic education, you can learn a lot yourself. For large portfolios, retirement planning, taxes, inheritance, leverage or complex cross-border investing, a qualified adviser can be useful.
20. Final verdict
U.S. stocks and Asian stocks both offer real opportunities, but they play different roles. U.S. stocks are often the cleanest starting point because they offer world-class companies, liquidity, transparency and simple ETF access. Asian stocks may offer stronger growth potential in selected sectors and countries, especially where earnings are improving, valuations are reasonable, and structural trends are powerful.
For a beginner, the smartest approach is usually not to predict the single winning market. It is to build a portfolio that can benefit from U.S. innovation and Asian growth while protecting yourself from the possibility that your favorite story is wrong. Use broad funds, keep costs low, diversify across time and regions, rebalance calmly, and never invest money you cannot afford to leave untouched for the long term.
Sources Consulted and Checked
These sources were consulted and checked while preparing this article to support accuracy, context, and factual reliability. Market data and rules can change, so readers should verify current figures and requirements through official sources before acting.
- MSCI USA Index data page: MSCI describes the index as covering large and mid-cap U.S. stocks and approximately 85% of U.S. free float-adjusted market capitalization; valuation snapshot included P/E 28.27 and dividend yield 1.11. URL: https://www.msci.com/indexes/index/984000
- MSCI AC Asia ex-Japan index data from MSCI factsheet snippets, May 29, 2026: P/E 20.55, forward P/E 12.88, P/BV 2.60, dividend yield 1.61, and recent performance data. URL: https://www.msci.com/documents/10199/255599/msci-ac-asia-ex-japan-high-dividend-yield.pdf
- MSCI Emerging Markets Asia index data from MSCI factsheet snippets, May 29, 2026: P/E 20.83, forward P/E 12.73, P/BV 2.73, dividend yield 1.47, and recent performance data. URL: https://www.msci.com/www/index-factsheets/msci-emerging-markets-asia/05704439
- BlackRock iShares MSCI USA UCITS ETF portfolio characteristics, June 2026: P/E and P/B ratio examples for investable U.S. exposure. URL: https://www.blackrock.com/dk/professionals/products/253740/ishares-msci-usa-b-ucits-etf
- J.P. Morgan Asset Management Guide to the Markets - Asia, data as of March 31, 2026: regional earnings-growth context including Korea and Asia ex-Japan technology estimates. URL: https://am.jpmorgan.com/content/dam/jpm-am-aem/global/en/insights/market-insights/guide-to-the-markets/guide-to-the-markets-asia.pdf
- Reuters market commentary on diversification across time, June 22, 2026: long-term investing context and warning against market timing. URL: https://www.reuters.com/commentary/reuters-open-interest/case-diversifying-across-time-2026-06-22/
Reader Advice
This article is provided solely for educational and informational purposes. It is not personalized investment, tax, legal, accounting, or financial-planning advice, and it does not recommend any particular security, fund, market, allocation, or strategy. Stock markets can decline substantially, investors may lose some or all of their invested capital, and past performance does not guarantee future results. Valuations, yields, fees, tax treatment, regulations, exchange rates, index composition, and market conditions may change based on time, jurisdiction, provider, and other factors.
Before making a decision, readers should assess their objectives, time horizon, financial position, risk tolerance, emergency savings, and local legal and tax requirements; verify facts and figures through current official sources; review the relevant prospectus and disclosures; and seek advice from appropriately qualified professionals when necessary.