How to Identify Bargain Stocks: Metrics Every Investor Should Know
1. Introduction: What Is a Bargain Stock?
A bargain stock is not simply a stock with a low price. A $5 stock can be expensive, and a $500 stock can be cheap. What matters is the relationship between the market price and the value of the business behind the stock.
In plain English, a bargain stock is a company whose shares appear to trade below a reasonable estimate of what the business is worth. Investors often call this an undervalued stock or a value stock. The idea is simple: buy a good or improving business when the market is overly pessimistic, then benefit if the market later recognizes its true value.
The hard part is that the market is not always wrong. Sometimes a stock looks cheap because investors have missed something. Other times it looks cheap because the business is shrinking, debt is high, management is weak, or the industry is being disrupted. That is why bargain stock investing requires both numbers and judgment.
This guide explains the core stock valuation ratios and business checks beginners should know. It also shows how to use them in a practical workflow, how to compare companies fairly, how to avoid value traps, and how to think like a careful investor instead of a bargain hunter chasing low prices.
2. The Simple Idea Behind Value Investing
Value investing is based on a common-sense belief: price and value are not always the same. Price is what the market asks today. Value is what the business may be worth based on earnings, assets, cash flow, growth, and risk.
For example, imagine a strong company earns steady profits, has low debt, pays a reliable dividend, and owns valuable assets. If temporary bad news pushes the stock down, the market price may fall below a fair estimate of business value. A value investor studies the facts and asks, “Is this a real discount, or is the business getting worse?”
A beginner should remember three rules:
- A low valuation ratio is a starting point, not a final answer.
- A bargain stock should have a reason it can recover, such as improving earnings, debt reduction, new management, buybacks, or an industry cycle turning upward.
- The best bargain is usually not the cheapest stock. It is the stock where the downside looks limited and the upside is realistic.
3. How Bargain Stock Analysis Works: The 6-Step Workflow
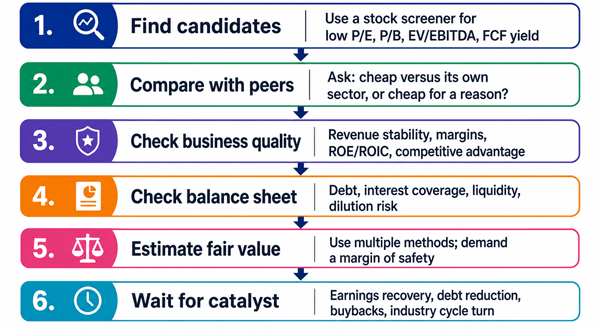
Beginners often make the mistake of jumping straight to a stock screener and buying the lowest P/E ratio they can find. A better process is slower, but much safer.
- Screen for candidates. Use a stock screener to find companies that look inexpensive on P/E, P/B, EV/EBITDA, dividend yield, or free cash flow yield.
- Compare with the right peer group. Banks should be compared with banks, retailers with retailers, software companies with software companies, and cyclical companies with their own cycle history.
- Check earnings quality. Ask whether profits are stable, recurring, and backed by real cash flow.
- Check financial strength. Look at debt, interest coverage, current ratio, and whether the company can survive a bad year.
- Estimate fair value. Use several valuation methods instead of trusting one ratio.
- Demand a margin of safety. Buy only when the potential discount is large enough to protect against mistakes.
4. Core Metrics Every Beginner Should Know
No single metric can prove that a stock is undervalued. The goal is to build a mosaic. Each metric answers a different question. Together, they help you decide whether the stock is truly a bargain or merely looks cheap.
| Metric | Formula / meaning | What it tells you | Beginner warning |
|---|---|---|---|
| P/E ratio | Share price ÷ earnings per share | How much investors pay for $1 of earnings | Low P/E may mean falling earnings, not undervaluation |
| Forward P/E | Price ÷ expected next-year earnings | How cheap the stock looks based on future profits | Analyst estimates can be wrong |
| PEG ratio | P/E ÷ expected earnings growth rate | Whether valuation is reasonable compared with growth | Growth forecasts are uncertain |
| P/B ratio | Market price ÷ book value per share | How price compares with accounting net assets | Less useful for asset-light companies |
| P/S ratio | Market cap ÷ revenue | Valuation compared with sales | Sales do not equal profit |
| EV/EBITDA | Enterprise value ÷ EBITDA | Valuation before financing and taxes | Can ignore capital spending needs |
| Free cash flow yield | Free cash flow ÷ market cap | Cash return generated by the business | One-time cash flow spikes can mislead |
| Debt-to-equity | Total debt ÷ shareholders’ equity | Balance-sheet risk | Normal debt levels vary by industry |
| ROE / ROIC | Profit return on equity or invested capital | Business quality and efficiency | High returns caused by excessive leverage can be risky |
| Dividend yield | Annual dividend ÷ share price | Income return from dividends | Very high yield can signal dividend cut risk |
4.1 Price-to-Earnings Ratio (P/E): The First Valuation Check
The P/E ratio tells you how many dollars investors are paying for one dollar of annual earnings. If a company trades at 10 times earnings, investors are paying $10 for every $1 of profit. If it trades at 30 times earnings, they are paying $30 for every $1 of profit.
A low P/E ratio can suggest a bargain, but only when earnings are healthy and reasonably sustainable. A company with a P/E of 8 may look cheaper than a company with a P/E of 20, but if the cheaper company’s earnings are about to collapse, the low P/E is a warning sign.
| Example company | Share price | Earnings per share | P/E ratio | Quick interpretation |
|---|---|---|---|---|
| Company A | $40 | $4.00 | 10x | Looks inexpensive if earnings are stable |
| Company B | $40 | $1.60 | 25x | More expensive unless growth is much stronger |
| Company C | $40 | $5.00 | 8x | Could be attractive, but check why market is skeptical |
Practical tip: Compare P/E with the company’s industry average, its own five- to ten-year history, and the quality of its earnings. A bank, utility, retailer, and cloud software company can all deserve very different P/E ratios.
4.2 Forward P/E: Useful, but Do Not Trust It Blindly
Forward P/E uses expected future earnings instead of past earnings. It can be helpful when a company had a bad temporary year or is recovering. For example, if a manufacturer had weak earnings during a downturn but orders are improving, next year’s profits may give a better picture.
The danger is that forward P/E depends on estimates. Analysts and management can be too optimistic. Beginners should check whether the company has a history of meeting guidance or regularly disappointing investors.
4.3 PEG Ratio: Adding Growth to the Valuation
The PEG ratio tries to answer an important question: is the P/E ratio justified by growth? A company with a P/E of 25 may not be expensive if earnings are growing 25% per year. A company with a P/E of 12 may not be cheap if earnings are shrinking.
| Company | P/E | Expected annual earnings growth | PEG | What it suggests |
|---|---|---|---|---|
| SlowGrow Co. | 12x | 3% | 4.0 | May not be cheap because growth is weak |
| SteadyValue Inc. | 15x | 10% | 1.5 | Possibly reasonable, needs more checks |
| FastCompounder Ltd. | 25x | 25% | 1.0 | Valuation may be justified if growth is real |
Practical tip: Treat PEG as a rough guide, not a rule. A PEG below 1 can look attractive, but growth estimates are often the weakest part of the calculation.
4.4 Price-to-Book Ratio (P/B): Best for Asset-Heavy Businesses
The P/B ratio compares a company’s market value with its accounting book value, which is roughly assets minus liabilities. It is especially useful for banks, insurers, real estate companies, and asset-heavy industrial businesses.
A P/B below 1 means the market values the company at less than its accounting net assets. That sounds attractive, but it can also mean investors believe the assets are overstated, future profits will be poor, or losses are coming.
Practical tip: P/B is less useful for modern asset-light businesses, such as software, brand-heavy consumer companies, and digital platforms. Their most valuable assets may be people, code, data, distribution, and brand reputation, which may not show fully on the balance sheet.
4.5 Free Cash Flow Yield: The Cash Reality Check
Free cash flow is the cash left after the company pays operating expenses and necessary capital spending. Free cash flow yield compares that cash flow with the company’s market value. Many experienced investors care about this metric because accounting earnings can be adjusted, but cash is harder to fake over long periods.
Formula: Free cash flow yield = free cash flow ÷ market capitalization.
If a company has a market value of $10 billion and generates $800 million in free cash flow, its free cash flow yield is 8%. That may be attractive if the cash flow is stable, debt is manageable, and the company can reinvest or return cash to shareholders.
Practical tip: Look at several years of free cash flow. One strong year caused by inventory reduction or delayed spending may not repeat.
4.6 EV/EBITDA: Comparing Companies With Different Debt Levels
Enterprise value, or EV, includes market value plus debt minus cash. EBITDA is earnings before interest, taxes, depreciation, and amortization. EV/EBITDA helps compare companies with different debt levels and tax situations.
This metric is common in professional investment research, private equity analysis, and stock analysis software. It can be useful for industrial, telecom, media, energy, and other capital-intensive businesses.
Beginner warning: EBITDA is not the same as free cash flow. A company can show attractive EBITDA but still need heavy capital spending, leaving little cash for shareholders.
4.7 Debt Ratios: Cheap Stocks With Too Much Debt Can Stay Cheap
Debt can turn a bargain into a trap. A company with high debt has less room for error. If sales fall or interest rates rise, lenders may benefit while shareholders suffer.
| Debt metric | What to look for | Why it matters |
|---|---|---|
| Debt-to-equity | Compare with industry peers | Shows how much debt supports the business |
| Net debt / EBITDA | Lower is usually safer; norms vary by sector | Shows how many years of EBITDA might be needed to repay debt |
| Interest coverage | Higher is better | Shows whether profits can cover interest payments |
| Current ratio | Usually above 1 is healthier, sector dependent | Shows short-term liquidity |
Practical tip: If debt is high, read the latest annual report or quarterly filing for debt maturity dates. A company with manageable debt due in 10 years is different from one facing a large refinancing next year.
4.8 ROE and ROIC: Measuring Business Quality
Return on equity (ROE) and return on invested capital (ROIC) help answer whether the company is good at turning capital into profit. A stock may look cheap, but if the business earns poor returns, it may deserve a low valuation.
ROIC is especially useful because it considers both debt and equity capital. A company that consistently earns high ROIC often has pricing power, operational discipline, strong brands, network effects, or cost advantages.
Practical tip: A bargain stock with improving ROIC can be more interesting than a statistically cheap stock with declining returns.
4.9 Dividend Yield: Income Can Be Helpful, but High Yield Can Be a Warning
Dividend yield is popular with beginners because it is easy to understand. If a stock pays $2 per year in dividends and trades at $40, the dividend yield is 5%. For dividend investing and retirement portfolio planning, yield can matter.
But a very high dividend yield often means the market expects a dividend cut. Before trusting a high yield, check the payout ratio, free cash flow coverage, debt, and management’s dividend history.
5. How to Tell If a Stock Is Cheap for a Good Reason
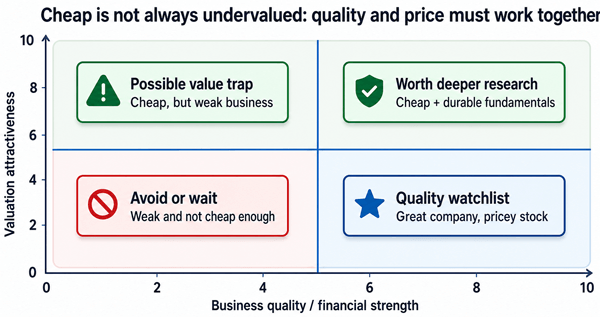
The biggest beginner mistake is assuming “cheap” means “safe.” Many cheap stocks become cheaper. These are called value traps. A value trap is a stock that looks undervalued on common ratios but continues to disappoint because the business is deteriorating.
5.1 Common signs of a value trap
- Revenue is falling for several years, not just one weak quarter.
- Margins are shrinking and management cannot clearly explain how they will recover.
- Debt is high and refinancing risk is near.
- The company issues new shares often, diluting existing shareholders.
- The dividend yield is high but free cash flow does not cover the dividend.
- The industry is facing permanent disruption, not a temporary downturn.
- Management blames every problem on external factors but has no credible plan.
- The stock has been “cheap” for years with no catalyst for improvement.
Investor experience lesson: Many experienced investors learn the hard way that the cheapest screen results are often cheap for a reason. A better habit is to ask, “What does the market think is wrong here, and do I have evidence that the market is too pessimistic?”
6. Practical Example: Comparing Two Possible Bargain Stocks
Assume you are comparing two companies in the same industry. Both look cheap at first glance, but the details tell a different story.
| Metric | Alpha Tools | Beta Tools | Better signal |
|---|---|---|---|
| P/E ratio | 9x | 8x | Beta looks slightly cheaper |
| Revenue trend | Growing 4% annually | Falling 6% annually | Alpha |
| Free cash flow yield | 7% | 3% | Alpha |
| Debt-to-equity | 0.5 | 2.4 | Alpha |
| ROIC | 14% | 5% | Alpha |
| Dividend yield | 3% | 8% | Beta looks higher |
| Dividend coverage | Covered by free cash flow | Not covered | Alpha |
| Management plan | Cost cuts + buybacks + debt discipline | No clear plan | Alpha |
A beginner might choose Beta Tools because it has the lower P/E and higher dividend yield. A more careful investor may prefer Alpha Tools because it has stronger cash flow, lower debt, better returns on capital, and a more credible plan. This is the difference between buying a low multiple and buying a bargain business.
7. Margin of Safety: Your Protection Against Being Wrong
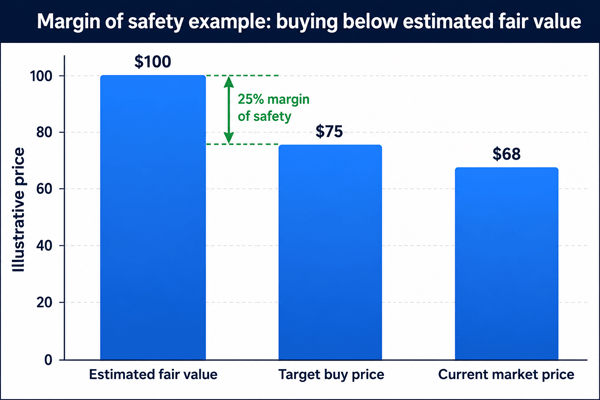
No investor can calculate a company’s exact value. A margin of safety is the gap between your estimate of fair value and the price you are willing to pay. It protects you from bad assumptions, weak markets, and unexpected business problems.
Example: If you estimate a stock is worth $100 per share, you might only consider buying below $75. That 25% discount is your margin of safety. The lower the quality or predictability of the business, the larger the margin of safety you should demand.
| Business type | Typical uncertainty | Suggested margin-of-safety thinking |
|---|---|---|
| Stable consumer staples | Lower | A smaller discount may be acceptable |
| Banks and insurers | Medium | Need careful asset and credit analysis |
| Cyclical industrials | High | Demand a larger discount near downturns |
| Turnarounds | Very high | Only consider with strong evidence and small position sizing |
| Highly leveraged companies | Very high | Often require a very large discount or avoidance |
8. Sector Context: Why the Same Ratio Means Different Things
A P/E of 12 can be cheap in one sector and expensive in another. A P/B of 1.2 can be normal for a bank but less useful for a software company. This is why beginner investors should avoid using universal rules without context.
| Sector | Useful metrics | Why |
|---|---|---|
| Banks | P/B, return on equity, loan quality, capital ratios | Book value and asset quality are central |
| Insurance | P/B, combined ratio, investment income, reserve quality | Balance sheet strength matters |
| Retail | P/E, operating margin, inventory turnover, same-store sales | Margins and inventory discipline drive results |
| Software | Revenue growth, free cash flow margin, net retention, EV/sales | Earnings may be temporarily low due to reinvestment |
| Energy | EV/EBITDA, free cash flow yield, debt, commodity price sensitivity | Profits are cyclical and commodity-driven |
| Utilities | Dividend yield, debt, allowed returns, regulatory environment | Stable but debt-heavy businesses |
| Industrials | EV/EBITDA, backlog, margins, ROIC, cycle position | Timing of the economic cycle matters |
9. How Beginners Can Use a Stock Screener Without Getting Misled
A stock screener is helpful because it narrows a large market into a manageable watchlist. It should not make the final decision for you. Think of it as a map, not a destination.
9.1 A simple beginner screen
- Market cap above your minimum size requirement to avoid illiquid microcaps.
- Positive earnings and positive free cash flow.
- P/E below the industry average or below the company’s own historical average.
- Debt-to-equity not extreme for the sector.
- ROE or ROIC above the sector median.
- Dividend payout ratio below a sustainable level if you are seeking income.
- Analyst estimate revisions stable or improving, if available.
After screening, read the company’s latest annual report, quarterly report, earnings call transcript, and investor presentation. If you use an investment research platform or online brokerage account with research tools, compare the company with at least three direct competitors.
10. The Beginner’s Bargain Stock Checklist
| Question | Yes / No | Why it matters |
|---|---|---|
| Is the company profitable over a full cycle? | One good quarter is not enough | |
| Is free cash flow positive and repeatable? | Cash supports dividends, buybacks, and debt reduction | |
| Is debt manageable? | High debt reduces room for mistakes | |
| Is the stock cheap versus peers and its own history? | Prevents false comparisons | |
| Are margins stable or improving? | Shows pricing power and cost control | |
| Does management allocate capital well? | Buybacks, dividends, debt reduction, and acquisitions affect returns | |
| Is there a realistic catalyst? | Cheap stocks need a reason to rerate | |
| Could the industry be permanently declining? | Avoids value traps | |
| Do you understand the business? | You cannot judge value if you do not understand the drivers | |
| Is the position size reasonable? | Even good analysis can be wrong |
11. Common Mistakes Beginners Make
11.1 Mistake 1: Buying only because the stock is down
A stock that has fallen 50% is not automatically cheap. It may still be expensive if earnings have fallen faster than the price. Always compare the new price with the new business reality.
11.2 Mistake 2: Ignoring share dilution
Some struggling companies issue new shares to raise cash. This can keep the business alive but reduce each existing shareholder’s ownership. Check the share count over time.
11.3 Mistake 3: Treating accounting earnings as cash
Earnings can look healthy while cash flow is weak. Free cash flow helps reveal whether profits are turning into usable cash.
11.4 Mistake 4: Comparing unrelated companies
A supermarket and a software company should not be judged by the same valuation rules. Peer comparison matters.
11.5 Mistake 5: Ignoring management quality
Good management can improve a mediocre situation. Poor management can destroy a cheap stock. Look for honest communication, realistic targets, and disciplined capital allocation.
11.6 Mistake 6: No exit plan
Before buying, write down why the stock is undervalued, what would prove you wrong, and what fair value you expect. This helps avoid emotional decisions later.
12. How to Build a Simple Investment Thesis
An investment thesis is a short explanation of why a stock may be worth more than the market price. It keeps your thinking clear.
| Part of thesis | Beginner-friendly example |
|---|---|
| What the company does | “The company sells essential industrial parts to recurring customers.” |
| Why the market dislikes it | “Margins fell because raw material costs rose and demand slowed.” |
| Why that may be temporary | “Input costs are easing, and order backlog remains stable.” |
| Why the valuation looks attractive | “The stock trades below its five-year average P/E and has a 7% free cash flow yield.” |
| What could unlock value | “Debt reduction, margin recovery, and share buybacks.” |
| What would prove you wrong | “Revenue keeps falling, debt rises, or free cash flow turns negative.” |
This written thesis is one of the most practical habits a beginner can develop. It turns investing from guessing into a repeatable process.
13. Risk Management: Bargain Stocks Still Carry Risk
Even careful analysis can be wrong. A company can face recession, fraud, regulation, lawsuits, technological disruption, currency shocks, or management mistakes. Bargain stock investing is not about avoiding risk completely. It is about being paid enough for the risk you take.
- Diversify across companies and sectors instead of betting everything on one “cheap” stock.
- Use position sizing. Riskier turnarounds should usually be smaller positions than stable compounders.
- Avoid excessive leverage in your own portfolio. Borrowed money can force bad decisions.
- Review the thesis after earnings reports, not every hour based on price movement.
- Be willing to sell when the facts change, not just when the price falls.
14. Helpful Facts and Rules of Thumb
| Rule of thumb | How to use it carefully |
|---|---|
| Low P/E is only attractive if earnings are sustainable | Check several years of earnings and cash flow |
| P/B works best for financial and asset-heavy companies | Do not overuse it for software or brand-driven firms |
| Free cash flow yield often reveals quality | Check whether cash flow is recurring |
| High dividend yield can be a warning | Check payout ratio and balance sheet |
| Debt matters more during downturns | Look at maturity dates and interest coverage |
| Cheap stocks need catalysts | Without a catalyst, undervaluation can persist for years |
| Use multiple valuation methods | One ratio can mislead; several signals are stronger |
15. Frequently Asked Questions
15.1 What is the easiest metric for beginners to start with?
Start with the P/E ratio, but do not stop there. Add free cash flow yield, debt-to-equity, ROE or ROIC, and peer comparison. This gives a more complete picture.
15.2 Is a low stock price the same as a bargain stock?
No. The share price alone tells you almost nothing. A $5 stock can be overvalued, while a $500 stock can be undervalued. Look at market capitalization, earnings, cash flow, assets, and debt.
15.3 What is the best ratio for finding undervalued stocks?
There is no single best ratio. P/E, PEG, P/B, EV/EBITDA, and free cash flow yield all answer different questions. The best approach is to use several ratios together and compare them with sector peers.
15.4 Can beginners use value investing?
Yes, but beginners should start slowly, use diversified portfolios, avoid highly leveraged companies, and focus on understanding the business before buying individual stocks.
15.5 Are bargain stocks good for long-term investing?
They can be, especially when the company is financially strong and the market is temporarily pessimistic. However, some cheap stocks remain cheap because the business keeps deteriorating.
15.6 Should I use a financial advisor?
A qualified financial advisor can help if you are unsure how individual stocks fit into your broader financial plan, retirement portfolio, tax situation, or risk tolerance. Education and professional advice can work together.
16. Conclusion: A Good Bargain Stock Has Price, Quality, and a Reason to Recover
The best bargain stocks are not just statistically cheap. They are companies where the market price appears too low compared with realistic business value, financial strength, cash generation, and future prospects.
For beginners, the safest mindset is simple: use valuation ratios to find candidates, use business analysis to avoid traps, use margin of safety to protect yourself, and use patience to let the thesis play out. Bargain stock investing rewards discipline more than excitement.
A practical final test is this: if you cannot explain in three sentences why the stock is undervalued, what could make it recover, and what could prove you wrong, you probably need more research before buying.
Reader Advice
This article is provided solely for educational and informational purposes. It does not constitute personal financial, investment, legal, tax, or professional advice, and it is not a recommendation to buy, sell, or hold any security. Investment decisions should be based on your own objectives, financial circumstances, risk tolerance, and time horizon.
Consider conducting independent research and consulting a suitably qualified financial advisor or other relevant professional before acting. Market conditions, company information, valuation norms, laws, regulations, tax rules, and other relevant factors may change over time or differ by jurisdiction. Readers should therefore verify current facts, figures, filings, and requirements through official and reliable sources before making any decision. All investments involve risk, including possible loss of principal, and past performance does not guarantee future results.
Sources Consulted and Checked
These sources were consulted and checked while preparing this article to support clarity, reliability, and accuracy.
[2] Investopedia, “Essential Metrics for Value Investors” - confirms common value-investing metrics such as P/E, P/B, debt-to-equity, free cash flow, and PEG.
[3] Investopedia, “Value Investing Definition, How It Works, Strategies, and Risks” - background definition of value investing.
[4] Charles Schwab, “Five Key Financial Ratios for Stock Analysis” - confirms practical use of P/E, PEG, ROE, P/B, and debt-to-equity ratios.
[5] Britannica Money, “Financial Ratios: P/E Ratio, PEG Ratio, P/B Ratio” - cross-check for beginner-friendly ratio definitions.
[6] CMC Markets, “Undervalued Stocks: How to Assess Value” - notes that valuation metrics help but do not provide certainty and warns about value traps.
[7] Recent market commentary reviewed in June 2026 showed that professional screens often combine forward P/E, PEG, analyst coverage, dividends, and quality checks rather than relying on one ratio.