Fear and Greed Index Explained: Meaning, How It Works, Examples, Benefits and Risks
1. Quick Answer
The Fear and Greed Index is a market sentiment indicator that tries to show whether investors are mainly acting from fear, greed, or a neutral mood. It usually uses a 0 to 100 scale. Low readings suggest fear, high readings suggest greed, and middle readings suggest a more balanced market mood.
Beginners should treat the index as a sentiment tool, not a buy-or-sell signal. It can help you understand market psychology, spot emotional extremes, and avoid panic decisions, but it cannot predict the market with certainty.
| Score range | Common meaning | Beginner interpretation |
|---|---|---|
| 0-24 | Extreme fear | Investors may be panicking or avoiding risk. Markets may be oversold, but risk can still be high. |
| 25-44 | Fear | Caution is high. Bad news may be dominating investor behavior. |
| 45-55 | Neutral | Sentiment is mixed. The market is not clearly fearful or greedy. |
| 56-75 | Greed | Investors are more willing to take risk. Prices may be rising strongly. |
| 76-100 | Extreme greed | Confidence may be excessive. Markets may be vulnerable to disappointment. |
Important note: Score labels can vary by provider. Always check the methodology of the specific index you are using.
2. What Is the Fear and Greed Index?
The Fear and Greed Index is a simple way to describe investor sentiment. Investor sentiment means the overall mood of market participants: are they nervous and defensive, or confident and aggressive?
When investors feel fear, they may sell stocks, buy safer assets, hold cash, or avoid new investments. When investors feel greed, they may buy more aggressively, chase rising prices, take bigger risks, or ignore warning signs.
The index turns many market signals into one easy-to-read number. Instead of asking beginners to analyze volatility, bond spreads, options activity, market breadth, and price momentum separately, it summarizes the emotional tone of the market on a scale.
A popular stock market version is the CNN Fear & Greed Index, which uses seven indicators: market momentum, stock price strength, stock price breadth, put and call options, junk bond demand, market volatility, and safe haven demand. These indicators are combined into a score from 0 to 100, with lower scores representing fear and higher scores representing greed.
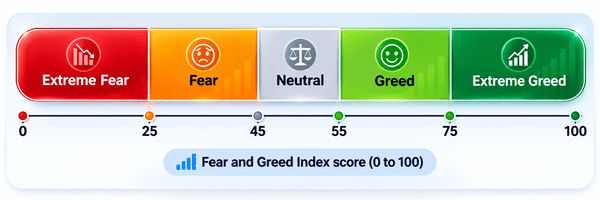
Figure 1: A simplified Fear and Greed Index score scale. Exact ranges may differ by provider.
3. Why Fear and Greed Matter in Markets
Markets are not moved only by earnings, interest rates, inflation, or economic data. They are also moved by human behavior. People become optimistic after strong gains and pessimistic after sharp losses. This emotional cycle can push prices above or below what fundamentals alone might justify.
Fear and greed matter because they can affect decisions in predictable ways:
- Fear can cause panic selling, hesitation, or selling good investments at bad prices.
- Greed can cause overconfidence, chasing trends, using too much leverage, or ignoring risk.
- Extreme sentiment can create crowded trades, where too many people are positioned the same way.
- Sentiment can change quickly when news, earnings, inflation data, interest-rate expectations, or geopolitical events shift investor confidence.
The index is useful because it reminds investors that markets are partly psychological. It gives beginners a quick way to ask: “Is the market calm, fearful, or overheated?”
4. How the Fear and Greed Index Works
The basic idea is simple: collect several market indicators, compare each one with its own historical range or average, convert them into sentiment scores, and combine them into one number.
- Choose sentiment indicators that reflect risk appetite, such as volatility, stock momentum, options activity, and demand for safer assets.
- Normalize each indicator so it can be compared on a common scale, usually 0 to 100.
- Interpret each indicator as fearful, neutral, or greedy based on how it behaves compared with history.
- Combine the indicator scores into a final index reading.
- Update the reading as new market data becomes available.
Different providers use different formulas. That is why two Fear and Greed Index tools may not show the same number on the same day. The important point is not the exact number alone, but what the number suggests about market behavior.
5. The Main Components of the Fear and Greed Index
Here are the common components used in a stock-market Fear and Greed Index and what each one tells you.
| Component | What it measures | Fear signal | Greed signal |
|---|---|---|---|
| Market momentum | Whether stocks are rising or falling compared with a longer-term trend, such as a moving average. | Prices falling below trend. | Prices rising strongly above trend. |
| Stock price strength | How many stocks are reaching new highs versus new lows. | More stocks hitting new lows. | More stocks hitting new highs. |
| Stock price breadth | Whether gains are broad across many stocks or concentrated in a few. | Weak participation; many stocks declining. | Broad participation; many stocks rising. |
| Put and call options | Whether traders are buying more downside protection or upside exposure. | More put buying, often linked with fear. | More call buying, often linked with speculation. |
| Market volatility | Expected market turbulence, often measured with volatility indexes such as the VIX. | High volatility. | Low volatility or complacency. |
| Safe haven demand | Whether investors prefer safer assets, such as government bonds, over stocks. | Strong demand for safe assets. | Preference for risk assets like stocks. |
| Junk bond demand | Investor appetite for riskier corporate bonds. | Wider spreads and lower appetite for risky credit. | Narrower spreads and stronger appetite for risky credit. |
No single component is perfect. For example, low volatility can mean investors are calm, but it can also mean they are too complacent. Strong momentum can reflect healthy earnings growth, but it can also reflect a crowded speculative rally. The value of the index comes from combining several signals rather than relying on one isolated data point.
6. How to Read Fear and Greed Index Scores
A beginner-friendly way to read the index is to think in zones rather than treating one exact number as magical. A reading of 82 is not automatically very different from 78. What matters is the broad zone, the trend, and the market context.
| Question to ask | Why it matters | Example |
|---|---|---|
| What zone is the index in? | Shows whether sentiment is fearful, neutral, or greedy. | A score near 15 suggests extreme fear. |
| Is the score rising or falling? | The direction can show whether sentiment is improving or deteriorating. | A move from 20 to 45 suggests fear is easing. |
| What is happening in the market? | Context prevents overreaction to the index alone. | Extreme fear during a banking scare is different from fear after a normal pullback. |
| Do fundamentals agree? | Sentiment should be compared with earnings, valuation, rates, and economic data. | Extreme greed with expensive valuations may call for caution. |
| What is your time horizon? | A trader and a long-term investor may use the same reading differently. | A long-term investor may rebalance; a trader may tighten risk controls. |
7. Fear and Greed Index Examples
7.1 Example 1: Extreme Fear After a Market Sell-Off
Imagine the stock market drops sharply for several weeks. News headlines are negative, volatility jumps, investors buy more put options, and money flows into government bonds. The index falls to 18.
A beginner might think, “The market is terrible, so I should sell everything.” But the index is not telling you to sell. It is telling you sentiment is extremely fearful. A more thoughtful response would be to review your plan, check your emergency fund, avoid panic selling, and consider whether high-quality investments are now priced more attractively.
7.2 Example 2: Extreme Greed During a Fast Rally
Now imagine stocks rise quickly for several months. Investors are excited, risky stocks are popular, call-option activity is high, volatility is low, and junk bond demand is strong. The index climbs to 84.
This does not mean the market must crash tomorrow. Markets can stay greedy for a long time. But it may be a warning to avoid chasing hype, review position sizes, rebalance if your portfolio has become too risky, and be careful with leverage.
7.3 Example 3: Neutral Sentiment in a Sideways Market
Suppose the index sits around 50 while the market moves sideways. Some indicators look positive and others look negative. In this situation, the index is not giving a strong emotional signal. Beginners should avoid forcing a conclusion and instead focus on fundamentals, diversification, and their investment plan.
8. Fear and Greed Index for Stocks vs Crypto
The phrase “Fear and Greed Index” is used in both stock and cryptocurrency markets, but the inputs may differ. A stock-market index may use volatility, breadth, safe haven demand, options activity, and credit spreads. A crypto Fear and Greed Index may use volatility, market momentum, social media activity, surveys, Bitcoin dominance, or search trends, depending on the provider.
| Feature | Stock-market Fear and Greed Index | Crypto Fear and Greed Index |
|---|---|---|
| Market covered | Usually broad equity markets such as U.S. stocks. | Usually Bitcoin or the broader crypto market. |
| Common inputs | Momentum, breadth, volatility, options, bonds, safe havens, credit spreads. | Volatility, momentum, volume, social signals, dominance, trends, surveys. |
| Risk profile | Still risky, but generally more mature and regulated. | Often more volatile and sentiment-driven. |
| Best use | Understanding broad investor mood in equities. | Understanding crypto market emotion and speculative pressure. |
| Main caution | May lag fast news and does not measure valuation directly. | Can be heavily influenced by social hype and sudden liquidity shifts. |
Do not compare a stock Fear and Greed score with a crypto Fear and Greed score as if they are the same instrument. They may use different data, formulas, and market assumptions.
9. Benefits of Using the Fear and Greed Index
The index can be helpful, especially for beginners, because it simplifies complicated market behavior into a clear sentiment reading.
| Benefit | How it helps | Practical use |
|---|---|---|
| Makes sentiment easier to understand | Turns several market signals into one readable score. | Quickly check whether the market mood is fearful or greedy. |
| Encourages emotional awareness | Reminds you that your own feelings may be influenced by the crowd. | Pause before panic selling or chasing a rally. |
| Supports contrarian thinking | Extreme fear can sometimes appear near attractive long-term opportunities; extreme greed can warn of overconfidence. | Use it as a prompt to review, not as an automatic trade signal. |
| Improves risk management | Highlights conditions where volatility or speculation may be elevated. | Adjust position sizes, rebalance, or avoid leverage during extremes. |
| Adds context to headlines | Helps separate emotional market reactions from long-term fundamentals. | Compare sentiment with earnings, valuations, rates, and your plan. |
10. Risks and Limitations
The Fear and Greed Index is useful, but it has serious limitations. Beginners should understand these before relying on it.
- It is not a prediction tool. A fearful market can become more fearful, and a greedy market can become more greedy.
- It may lag events because many inputs are based on market data that has already moved.
- It does not tell you whether a specific stock, ETF, or crypto asset is good value.
- It can give false comfort. A neutral reading does not mean risk is low.
- It may be less useful for individual stocks because it usually measures broad market sentiment.
- Different providers use different methods, so readings are not always comparable.
- Extreme readings can persist for weeks or months, which can frustrate traders who expect immediate reversals.
The safest approach is to use the index as one tool among many. Combine it with fundamentals, valuation, technical analysis if you use it, risk management, and your personal financial goals.
11. Common Mistakes Beginners Make
| Mistake | Why it is a problem | Better approach |
|---|---|---|
| Buying only because the index shows fear | Fear may reflect real risks, not just temporary panic. | Ask why investors are fearful and whether fundamentals are still sound. |
| Selling everything because the index shows greed | Greedy markets can continue rising. | Rebalance gradually instead of making emotional all-or-nothing moves. |
| Treating one reading as a signal | A single number without context can mislead. | Look at the trend and market background. |
| Using it for individual stock decisions | Broad sentiment may not apply to one company. | Analyze the company separately. |
| Ignoring your time horizon | Short-term sentiment may not matter much for a long-term retirement plan. | Match the tool to your goal and time frame. |
| Confusing sentiment with value | A cheap-looking market can get cheaper; an expensive market can stay expensive. | Use valuation and fundamentals alongside sentiment. |
12. How Beginners Can Use the Fear and Greed Index Responsibly
Here is a practical, beginner-friendly process.
- Check the index as a market mood indicator, not as a trading command.
- Identify the zone: extreme fear, fear, neutral, greed, or extreme greed.
- Look at the trend over days or weeks. Is sentiment improving, worsening, or staying extreme?
- Compare the reading with market facts: earnings, interest rates, inflation, economic data, valuations, and major news.
- Review your portfolio risk. Are you overexposed to one asset, sector, or theme?
- Make decisions based on your plan. Rebalancing, dollar-cost averaging, or reducing leverage may be more sensible than dramatic trades.
- Write down your reason before acting. This helps you separate a plan-based decision from an emotional reaction.
A useful rule: Let the index start a question, not finish the answer. For example, “The market is in extreme greed. Am I taking too much risk?” is a better question than “The market is in extreme greed, so I must sell now.”
13. Practical Strategies Based on Different Readings
| Index zone | What it may suggest | Practical response for beginners |
|---|---|---|
| Extreme fear | Panic, high volatility, risk avoidance. | Avoid panic selling. Review long-term goals. Consider gradual buying only if it fits your plan and risk tolerance. |
| Fear | Cautious mood and negative headlines. | Stay disciplined. Look for quality, but do not ignore real risks. |
| Neutral | Mixed sentiment. | Focus on fundamentals, diversification, and regular investing habits. |
| Greed | Rising confidence and stronger risk appetite. | Avoid chasing. Check whether your portfolio has become too concentrated. |
| Extreme greed | Possible overconfidence or speculative behavior. | Rebalance if needed, reduce leverage, tighten risk controls, and avoid FOMO decisions. |
14. Is the Fear and Greed Index a Contrarian Indicator?
Often, yes - but not perfectly. A contrarian indicator is a tool that can suggest doing the opposite of the crowd at emotional extremes. When the index shows extreme fear, some investors look for buying opportunities. When it shows extreme greed, some investors become more cautious.
However, contrarian investing is not as simple as buying every fearful reading and selling every greedy reading. Sometimes fear is justified by serious problems. Sometimes greed is supported by strong earnings, improving economic conditions, or lower interest rates. The index can highlight emotional extremes, but it cannot tell you whether the market is fundamentally mispriced.
15. Fear and Greed Index vs Other Market Sentiment Tools
| Tool | What it shows | How it differs from the Fear and Greed Index |
|---|---|---|
| VIX | Expected stock market volatility over the near term. | The VIX is usually one component or related input, while the Fear and Greed Index combines multiple indicators. |
| Put/call ratio | Options positioning and demand for puts versus calls. | Useful but narrower; it focuses on options behavior. |
| Market breadth indicators | How many stocks are participating in a move. | Shows internal market strength; the Fear and Greed Index adds other sentiment signals. |
| AAII or investor surveys | What investors say they feel or expect. | Survey-based sentiment may differ from what investors actually do with money. |
| Fundamental valuation metrics | Whether assets look expensive or cheap based on earnings, cash flows, or book value. | Valuation is not the same as sentiment; both can be useful together. |
16. Best Practices for Investors
- Use it weekly or during major market moves, not obsessively every few minutes.
- Focus on extreme readings and trend changes, not tiny daily movements.
- Combine it with a written investment plan, asset allocation, and risk limits.
- Never use it as the only reason to buy, sell, short, or use leverage.
- For long-term investing, consider dollar-cost averaging and rebalancing instead of trying to time every market turn.
- Check the methodology of the index source, especially if using a crypto-specific version.
- Remember that sentiment is only one layer of market analysis. Fundamentals and risk management still matter.
17. Who Should Use the Fear and Greed Index?
The index can be useful for beginner investors, long-term investors, traders, financial writers, and anyone trying to understand market psychology. It is especially helpful for people who struggle with emotional decision-making during market swings.
It may be less useful for someone who needs detailed security-level analysis, such as valuing a single company or building a professional trading model. In those cases, the index can provide background context, but it is not enough on its own.
18. Final Takeaway
The Fear and Greed Index is a simple sentiment gauge that helps beginners understand whether markets are acting fearful, greedy, or neutral. Its biggest value is not prediction. Its value is perspective.
Used wisely, it can help you pause before emotional decisions, recognize crowd behavior, and manage risk more thoughtfully. Used poorly, it can become another shortcut that encourages market timing and overconfidence.
The best way to use the Fear and Greed Index is as a conversation starter with yourself: “What is the market feeling, why is it feeling that way, and does my portfolio still match my plan?”
19. FAQs About the Fear and Greed Index
19.1 What does the Fear and Greed Index measure?
It measures market sentiment, or the emotional tone of investors. Low scores suggest fear, high scores suggest greed, and middle scores suggest neutral or mixed sentiment.
19.2 What is a good Fear and Greed Index number?
There is no universally “good” number. Extreme fear can sometimes create opportunities but may also reflect real danger. Extreme greed can signal confidence but may also warn of overconfidence. Context matters.
19.3 Does extreme fear mean I should buy?
Not automatically. Extreme fear means investors are nervous. Before buying, consider fundamentals, valuation, your time horizon, cash needs, and risk tolerance.
19.4 Does extreme greed mean a crash is coming?
No. Extreme greed can warn that investors may be too confident, but it does not predict the timing of a downturn. Markets can stay greedy for longer than expected.
19.5 Can beginners rely on the Fear and Greed Index?
Beginners can use it as an educational and risk-awareness tool. They should not rely on it as a stand-alone trading system.
19.6 How often does the index update?
Update frequency depends on the provider and the data inputs. Some components may update as new market data becomes available.
19.7 Is the Fear and Greed Index useful for long-term investors?
Yes, but mostly as a reminder about emotion and risk. Long-term investors should focus more on goals, diversification, costs, valuation, and discipline than on short-term sentiment.
19.8 Is the crypto Fear and Greed Index the same as the stock market version?
No. Crypto versions often use different inputs, such as volatility, momentum, social signals, dominance, and search trends. Always check the methodology.
19.9 What is the biggest limitation of the Fear and Greed Index?
Its biggest limitation is that it describes sentiment; it does not prove what the market will do next. It should be combined with other analysis and sound risk management.
19.10 How should I use the index in practice?
Use it to identify emotional extremes, review your portfolio risk, avoid panic and FOMO, and make decisions based on a plan rather than crowd emotion.
Sources Consulted and Checked
The following sources were consulted and checked while preparing this article and reviewing its accuracy:
- CNN Fear & Greed Index methodology summaries.
- Market sentiment education materials.
- Public explanations of volatility, put/call options, market breadth, safe-haven demand, and high-yield credit spreads.
Reader Advice
This article is provided for educational and informational purposes only. It explains a market-sentiment tool and does not constitute personalized financial, investment, trading, legal, tax, or other professional advice or a recommendation to buy, sell, or hold any asset. Market conditions can change quickly, and investing or trading may involve volatility, loss of capital, liquidity risk, and other risks. Index methodologies, provider labels, rules, policies, laws, and statistics may change over time and may vary by country or region. Before making a decision, verify current information through official sources, review the relevant provider methodology, consider your goals and risk tolerance, and seek advice from an appropriately qualified professional where needed.