RSI Indicator Explained: Meaning, How It Works, Examples, Benefits and Risks
The Relative Strength Index, usually called the RSI indicator, is one of the most popular tools used in technical analysis. Traders use it to understand whether an asset has recently moved too far, too fast in one direction. It can help identify momentum, possible trend weakness, overbought or oversold conditions, and potential trading opportunities.
RSI is useful because it turns recent price movement into a simple number between 0 and 100. A high RSI usually means price has had strong upward momentum. A low RSI usually means price has had strong downward momentum. However, RSI does not predict the future by itself. It is a decision-support tool, not a guaranteed buy or sell signal.
This guide explains the RSI indicator in plain English, including how it works, how to read it, practical examples, benefits, limitations, common mistakes, and best practices for beginners.
1. Quick Answer: What Is the RSI Indicator?
The RSI indicator is a momentum oscillator that measures the speed and size of recent price changes. It moves between 0 and 100 and is commonly used to identify whether a market may be overbought, oversold, strengthening, weakening, or forming a divergence.
| RSI Area | Common Meaning | Beginner Interpretation |
|---|---|---|
| Above 70 | Often called overbought | Price has risen strongly; avoid assuming it must fall immediately. |
| Around 50 | Neutral or trend balance area | Above 50 often supports bullish momentum; below 50 often supports bearish momentum. |
| Below 30 | Often called oversold | Price has fallen strongly; avoid assuming it must bounce immediately. |
| Rising RSI | Momentum improving | Buyers may be gaining strength. |
| Falling RSI | Momentum weakening | Sellers may be gaining strength. |
2. What Does RSI Mean?
RSI stands for Relative Strength Index. The word “relative” means it compares the size of recent gains with the size of recent losses. The word “strength” refers to the strength of recent price momentum, not the financial strength of a company, coin, or project.
For example, if Bitcoin, Apple stock, gold, or a currency pair has been closing higher for many candles, RSI will usually rise. If it has been closing lower for many candles, RSI will usually fall. This makes RSI helpful for seeing momentum that may not be obvious from the price chart alone.
3. Who Created the RSI Indicator?
The RSI indicator was developed by J. Welles Wilder Jr., a technical analyst who introduced several well-known trading indicators. The classic RSI setting is 14 periods, which means the indicator looks back over the last 14 candles, days, hours, or other chart periods depending on the timeframe being used.
Although the default setting is 14, traders may adjust it. A shorter RSI setting reacts faster but creates more false signals. A longer setting reacts more slowly but may be smoother and less noisy.
4. What Does RSI Measure?
RSI measures momentum, not value. This is important. A stock, crypto coin, or forex pair can have a high RSI and still continue rising. It can also have a low RSI and still continue falling. RSI tells you how strong recent movement has been, not whether the asset is cheap or expensive in a fundamental sense.
Think of RSI like a speed gauge. If a car is going very fast, it may need to slow down, but the speed gauge does not tell you exactly when the driver will brake. RSI works in a similar way: it warns that momentum is strong or stretched, but price can remain stretched for longer than expected.
5. How the RSI Indicator Works
The RSI calculation compares average gains and average losses over a chosen period. Most charting platforms calculate RSI automatically, so beginners do not need to do the math by hand. Still, understanding the basic idea helps you use the indicator more wisely.
5.1 RSI Formula in Simple Terms
The standard RSI formula is:
RSI = 100 - [100 / (1 + RS)]
RS means relative strength. It is calculated by dividing the average gain by the average loss over the selected period. For the standard 14-period RSI, the indicator compares average gains and losses over the last 14 candles.
| Step | What Happens |
|---|---|
| 1 | Choose a period, commonly 14 candles. |
| 2 | Measure each candle’s gain or loss based on closing prices. |
| 3 | Calculate the average gain and average loss. |
| 4 | Compare average gains with average losses. |
| 5 | Convert the result into a number from 0 to 100. |
5.2 RSI Settings: 14, 7, 21 and Other Periods
| RSI Setting | How It Behaves | Common Use |
|---|---|---|
| 7-period RSI | Very sensitive and fast-moving | Short-term trading, scalping, quick signals, but more noise. |
| 14-period RSI | Balanced default setting | General chart analysis across stocks, crypto, forex, and commodities. |
| 21-period RSI | Smoother and slower | Swing trading, trend filtering, fewer but later signals. |
| Custom settings | Depends on market and strategy | Used after testing, not because a setting “feels right.” |
6. RSI Chart Example
The chart below shows a simple RSI line with common reference levels at 70, 50, and 30. These levels are guides, not automatic trade commands.
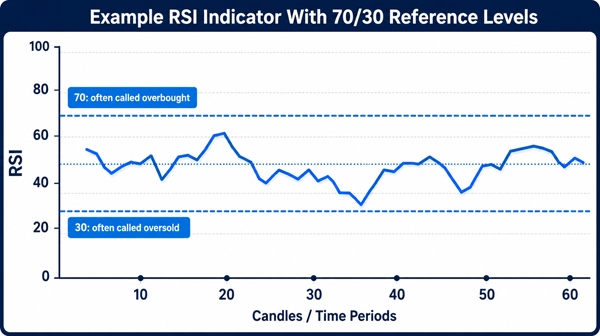
Figure: Example RSI indicator with common 70, 50, and 30 reference levels. In real trading, RSI should be checked together with price action, trend direction, volume, support and resistance, and risk management.
7. How to Read the RSI Indicator
7.1 Overbought RSI
An RSI above 70 is often called overbought. This means price has risen strongly compared with recent losses. Many beginners think overbought means “sell now,” but that is not always correct. In strong uptrends, RSI can stay above 70 for a long time while price continues rising.
A better interpretation is: RSI above 70 tells you the market may be stretched and you should be more careful about entering late. It may be a reason to wait for a pullback, tighten risk, or look for confirmation before buying.
7.2 Oversold RSI
An RSI below 30 is often called oversold. This means price has fallen strongly compared with recent gains. Beginners often think oversold means “buy now,” but a weak market can keep falling even after RSI drops below 30.
A better interpretation is: RSI below 30 tells you selling pressure has been strong and the market may be stretched to the downside. A bounce is possible, but confirmation is still needed.
7.3 The 50 Line
The 50 level is a useful middle line. When RSI stays above 50, bullish momentum is often stronger. When RSI stays below 50, bearish momentum is often stronger. This can help beginners avoid fighting the trend.
7.4 RSI Divergence
RSI divergence happens when price and RSI move in different directions. It can warn that momentum is weakening, but it is not a perfect reversal signal.
| Divergence Type | What It Looks Like | Possible Meaning |
|---|---|---|
| Bullish divergence | Price makes a lower low, but RSI makes a higher low. | Selling momentum may be weakening; a bounce or reversal may become more likely. |
| Bearish divergence | Price makes a higher high, but RSI makes a lower high. | Buying momentum may be weakening; a pullback or reversal may become more likely. |
| Hidden bullish divergence | Price makes a higher low, but RSI makes a lower low. | Possible trend continuation in an uptrend. |
| Hidden bearish divergence | Price makes a lower high, but RSI makes a higher high. | Possible trend continuation in a downtrend. |
8. Practical RSI Examples for Beginners
8.1 RSI in an Uptrend
A stock is making higher highs and higher lows. RSI repeatedly moves between 45 and 75. Instead of selling every time RSI crosses 70, a trader may wait for RSI to cool near 40-50 and then look for price support before considering a new long setup.
8.2 RSI in a Downtrend
A crypto coin is making lower highs and lower lows. RSI keeps failing near 50-60 and then falls again. In this case, an RSI reading below 30 may not be enough reason to buy. A beginner should wait for stronger confirmation, such as a break above resistance or a higher low on price.
8.3 Bullish Divergence
Price falls from $100 to $90, bounces, then falls again to $87. But RSI does not make a lower low; it makes a higher low. This suggests sellers may be losing strength. A trader might watch for a resistance breakout before entering, instead of buying only because divergence exists.
8.4 Bearish Divergence
Price rises from $50 to $60, pulls back, then rises to $63. However, RSI makes a lower high. This may warn that the rally is losing momentum. A trader might avoid chasing the move or may protect profits if price breaks support.
9. Benefits of Using the RSI Indicator
- Easy to understand: RSI gives a clear 0 to 100 reading.
- Works across many markets: stocks, crypto, forex, indices, commodities, and ETFs.
- Helps identify momentum: rising RSI suggests improving strength; falling RSI suggests weakening strength.
- Can highlight stretched conditions: overbought and oversold areas help traders avoid emotional entries.
- Useful for spotting divergence: RSI can show weakening momentum before price clearly turns.
- Works well with other tools: RSI is more useful when combined with trend lines, support and resistance, moving averages, and volume.
10. Risks and Limitations of RSI
| Risk or Limitation | Why It Matters | How to Reduce the Problem |
|---|---|---|
| False signals | RSI can show overbought or oversold conditions while price keeps trending. | Use trend direction and price confirmation. |
| Late signals | RSI uses past price data, so it can react after the move has already started. | Do not treat RSI as a prediction tool. |
| Bad in strong trends if used alone | Selling overbought RSI in an uptrend can cause missed gains or losses. | Adjust interpretation based on market trend. |
| Divergence can fail | Price may continue in the same direction even after divergence appears. | Wait for a break of structure, support, or resistance. |
| Parameter sensitivity | A 7-period RSI and 21-period RSI can give different signals. | Test settings and keep them consistent. |
| No risk control | RSI does not tell you position size, stop-loss distance, or account risk. | Use a trading plan and risk management rules. |
11. RSI Compared With Other Indicators
| Indicator | Main Purpose | Best Used For | Main Weakness |
|---|---|---|---|
| RSI | Measures momentum on a 0-100 scale. | Overbought/oversold readings, divergence, momentum shifts. | Can give false signals in strong trends. |
| MACD | Shows trend momentum using moving averages. | Trend changes and momentum confirmation. | Can lag during fast moves. |
| Stochastic Oscillator | Compares close price to recent range. | Short-term momentum and range-bound markets. | Can be noisy. |
| Moving Average | Smooths price to show trend direction. | Trend filtering and dynamic support/resistance. | Lags behind price. |
| Volume | Shows trading activity. | Confirming breakouts and participation. | May be harder to interpret across some markets. |
12. How Beginners Can Use RSI Safely: A Step-by-Step Process
- Identify the main trend first. Check whether price is making higher highs and higher lows, lower highs and lower lows, or moving sideways.
- Add RSI with the standard 14-period setting. Keep the default setting at first so you can learn how it behaves.
- Use 70 and 30 as warning zones, not automatic buy or sell signals.
- Watch the 50 line to understand whether momentum is generally bullish or bearish.
- Look for confirmation from price action, such as support, resistance, breakout, rejection candles, or trendline breaks.
- Define risk before entering. Decide your stop-loss, position size, and invalidation point before placing a trade.
- Review the result. After the trade, check whether RSI helped or whether you forced a signal that was not really there.
13. Common RSI Mistakes to Avoid
- Buying only because RSI is below 30.
- Selling only because RSI is above 70.
- Ignoring the overall trend.
- Using RSI divergence without waiting for confirmation.
- Changing RSI settings after every losing trade.
- Using RSI on very low-liquidity assets where price can move sharply on small volume.
- Taking trades without stop-loss planning.
- Assuming RSI works the same way on every timeframe and every asset.
14. RSI Best Practices
| Best Practice | Why It Helps |
|---|---|
| Start with the 14-period RSI | It is the most common default and gives a balanced introduction. |
| Use RSI with trend analysis | RSI signals are more meaningful when viewed in context. |
| Treat 70/30 as zones | Markets can remain overbought or oversold longer than expected. |
| Check multiple timeframes carefully | A lower-timeframe signal can be weak if the higher timeframe is strongly trending against it. |
| Combine RSI with support and resistance | A signal near an important level is usually more useful than a signal in the middle of nowhere. |
| Keep a trading journal | Recording RSI signals helps you learn what works in your market and timeframe. |
| Use proper position sizing | Even a good indicator cannot protect you from oversized trades. |
15. RSI Pros and Cons
| Pros | Cons |
|---|---|
| Simple and beginner-friendly. | Can create false confidence if used alone. |
| Available on almost every charting platform. | Overbought and oversold signals can fail in strong trends. |
| Useful for momentum and divergence analysis. | Does not include volume, news, fundamentals, or liquidity. |
| Can be used across many markets and timeframes. | Different settings can produce different readings. |
| Helps reduce emotional chasing when used properly. | Requires confirmation and risk management. |
16. FAQs About the RSI Indicator
16.1 What is the best RSI setting for beginners?
The standard 14-period RSI is usually the best starting point. It is widely used, balanced, and available by default on most charting platforms.
16.2 Is RSI better for day trading or swing trading?
RSI can be used for both, but the interpretation changes by timeframe. Short timeframes create more signals and more noise. Higher timeframes usually produce fewer but more meaningful signals.
16.3 Does RSI work in crypto?
Yes, RSI is commonly used in crypto markets, but crypto can be highly volatile. RSI signals can fail quickly, especially during strong trends, news events, liquidations, or low-liquidity conditions.
16.4 Should I buy when RSI is below 30?
Not automatically. RSI below 30 means strong recent selling pressure. Price may bounce, but it may also continue falling. Look for confirmation from price action and risk-reward before entering.
16.5 Should I sell when RSI is above 70?
Not automatically. RSI above 70 means strong recent buying pressure. In a strong uptrend, price can keep rising while RSI remains high.
16.6 What is RSI divergence?
RSI divergence happens when price and RSI disagree. For example, price makes a lower low while RSI makes a higher low. This may suggest weakening momentum, but confirmation is still needed.
16.7 Can RSI predict market reversals?
RSI can warn that momentum may be weakening, but it cannot reliably predict reversals by itself. It is better used as part of a broader trading plan.
16.8 Is RSI a leading or lagging indicator?
RSI is often described as a momentum oscillator. It can sometimes warn of weakening momentum before price reverses, but it is still calculated from past price data.
16.9 What markets can RSI be used on?
RSI can be used on stocks, crypto, forex, indices, commodities, and ETFs, as long as the market has enough liquidity and reliable price data.
16.10 What should RSI be combined with?
Beginners often combine RSI with support and resistance, trend direction, moving averages, volume, candlestick patterns, and clear risk management rules.
17. Final Thoughts: Is RSI Useful for Beginners?
The RSI indicator is useful because it gives beginners a simple way to understand momentum. It can show when price may be stretched, when momentum is improving or weakening, and when divergence may be forming. But RSI is not magic. It should not be used as a standalone buy or sell signal.
The best way to use RSI is to combine it with market structure, trend direction, support and resistance, volume, and proper risk management. When used this way, RSI can become a practical tool for making more disciplined trading decisions.
Reader Advice
This article is provided for educational and informational purposes only. It explains the RSI indicator in general terms and is not personalized financial, investment, trading, legal, tax, or professional advice, nor a recommendation to buy, sell, or hold any asset. Trading and investing involve risk, including the possible loss of capital, and RSI signals may be delayed, misleading, or unsuccessful, especially during strong trends, volatile markets, news events, or low-liquidity conditions. Rules, policies, laws, market practices, platform features, and statistics can change over time and may vary by country or region, so readers should verify current information through official and reliable sources and consider qualified professional advice before making decisions. Use suitable risk management, test strategies carefully, and never risk money you cannot afford to lose.