Candlestick Patterns for Crypto: Complete Guide, Examples, Risks and Best Practices
Candlestick patterns are one of the most popular ways traders read crypto price charts. A candlestick shows how price moved during a specific time period, such as one minute, one hour, one day, or one week. By looking at the size of the candle body, the length of the wicks, and where the candle appears on the chart, traders try to understand whether buyers or sellers are in control.
This guide explains candlestick patterns for crypto from the ground up. It covers what candles mean, common bullish and bearish patterns, practical examples, confirmation methods, risk management, mistakes to avoid, and best practices. The goal is not to make candlesticks sound magical. The goal is to help you use them carefully as one part of a broader trading or investing process.
1. What Is a Candlestick in Crypto Trading?
A candlestick is a chart symbol that summarizes price movement during one selected time period. Each candle contains four main prices: open, high, low, and close. These are often called OHLC data.
| Term | Meaning | Beginner example |
|---|---|---|
| Open | The price at the start of the candle period. | Bitcoin opens the 1-hour candle at $60,000. |
| High | The highest price reached during the period. | Price rises as high as $61,200. |
| Low | The lowest price reached during the period. | Price falls as low as $59,600. |
| Close | The price at the end of the period. | The 1-hour candle closes at $60,900. |
If the close is higher than the open, the candle is usually considered bullish because price ended the period higher than it started. If the close is lower than the open, the candle is usually considered bearish because price ended the period lower than it started. Charting platforms may use green and red candles, white and black candles, or custom colors.
Simple Candlestick Diagram
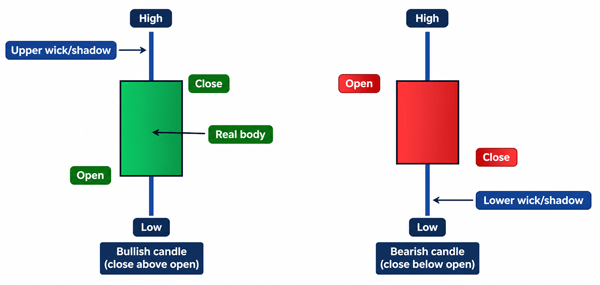
Figure: The real body shows the distance between open and close. Wicks show how far price moved above or below the body before the candle closed.
2. Why Candlestick Patterns Matter in Crypto
Crypto trades 24 hours a day, seven days a week. Prices can change quickly, and candlesticks give traders a compact way to read that movement. A single candle may show hesitation, rejection, momentum, or panic. A group of candles may show a potential trend continuation or reversal.
- They help traders visualize buying and selling pressure.
- They make support and resistance reactions easier to see.
- They can help plan entries, exits, and stop-loss levels.
- They work across many timeframes, from short-term trading to long-term investing.
- They are easy to combine with volume, trendlines, moving averages, and risk management rules.
However, candlestick patterns are only clues. A hammer candle near a strong support area is more meaningful than a hammer in the middle of a choppy chart. A breakout candle with strong volume is more convincing than a breakout candle with weak volume. Context matters more than pattern names.
3. How to Read a Crypto Candlestick Step by Step
- Choose the timeframe. A 5-minute candle shows short-term noise, while a daily candle shows broader market behavior. Beginners should usually study higher timeframes first, such as 4-hour and daily charts.
- Identify whether the candle is bullish or bearish. Compare the open and close.
- Look at the body size. A large body suggests stronger momentum. A tiny body suggests hesitation or balance between buyers and sellers.
- Look at the wick length. Long wicks show price rejection or failed attempts to move higher or lower.
- Check where the candle appears. A reversal pattern near support or resistance has more value than the same pattern in random chart noise.
- Confirm with volume and the next candle. A pattern is stronger when the next candle supports the signal and volume agrees.
4. Single-Candle Patterns Every Beginner Should Know
Single-candle patterns are easy to recognize, but they should never be used alone. Their meaning depends heavily on trend, support, resistance, volatility, and volume.
| Pattern | What it looks like | Possible meaning | Best context |
|---|---|---|---|
| Doji | Very small body; open and close are close together. | Indecision between buyers and sellers. | After a strong move, near support or resistance. |
| Hammer | Small body near the top with a long lower wick. | Sellers pushed price down, but buyers recovered. | After a downtrend or near support. |
| Shooting Star | Small body near the bottom with a long upper wick. | Buyers pushed price up, but sellers rejected it. | After an uptrend or near resistance. |
| Marubozu | Large body with little or no wick. | Strong directional momentum. | Breakouts, breakdowns, or trend continuation. |
| Spinning Top | Small body with wicks on both sides. | Uncertainty and reduced momentum. | After a strong move or during consolidation. |
4.1 Example: Hammer Candle Near Support
Imagine Ethereum has been falling for several days and reaches a previous support zone around $3,000. During the day, price drops to $2,890, but buyers step in and the candle closes near $3,060. The candle has a long lower wick and a small body near the top. This may be read as a hammer.
A beginner should not buy immediately just because the candle looks like a hammer. A more careful approach is to ask: Did this happen at a known support level? Did volume increase? Did the next candle close above the hammer high? Where would the trade be invalidated if price falls again?
4.2 Example: Shooting Star Near Resistance
Suppose Solana has rallied quickly into a resistance zone at $180. Price briefly pushes to $188 but then falls back and closes near $176. The candle leaves a long upper wick. This may suggest that buyers could not maintain control at higher prices. A cautious trader may wait for the next candle to close lower before treating it as a bearish signal.
5. Two-Candle Patterns: Reversals and Momentum Shifts
| Pattern | Structure | Possible signal | Beginner note |
|---|---|---|---|
| Bullish Engulfing | A bearish candle followed by a larger bullish candle that covers the prior body. | Buyers may be taking control. | Stronger after a downtrend and near support. |
| Bearish Engulfing | A bullish candle followed by a larger bearish candle that covers the prior body. | Sellers may be taking control. | Stronger after an uptrend and near resistance. |
| Tweezer Bottom | Two candles with similar lows. | Price may be defending a support area. | Look for confirmation above the small range. |
| Tweezer Top | Two candles with similar highs. | Price may be rejecting resistance. | More useful when volume weakens on the second high. |
| Inside Bar | Second candle is fully inside the range of the previous candle. | Consolidation before a possible breakout. | Trade the break of the mother candle only with risk control. |
5.1 Example: Bullish Engulfing on Bitcoin
Bitcoin falls into a support zone and prints a red daily candle. The next day opens slightly lower but closes strongly above the previous candle body. This creates a bullish engulfing pattern. A practical trading plan might be: wait for the candle to close, consider entry only if the broader trend or support area supports the idea, place a stop below the pattern low, and define a target before entering.
6. Three-Candle Patterns and Multi-Candle Setups
| Pattern | What it suggests | How to confirm |
|---|---|---|
| Morning Star | A possible bullish reversal after a decline. | Third candle should close strongly upward, ideally with volume. |
| Evening Star | A possible bearish reversal after a rally. | Third candle should close strongly downward. |
| Three White Soldiers | Strong bullish continuation or reversal. | Candles should close progressively higher, not be extremely overextended. |
| Three Black Crows | Strong bearish continuation or reversal. | Candles should close progressively lower, ideally from resistance or after trend weakness. |
| Rising Three Methods | Bullish continuation during an uptrend. | Small pullback candles hold above key support, then trend resumes. |
| Falling Three Methods | Bearish continuation during a downtrend. | Small bounce candles fail below resistance, then downtrend resumes. |
7. Bullish vs Bearish Candlestick Patterns
The table below compares common bullish and bearish patterns. Remember that a pattern is not automatically good or bad. It is only useful when it fits the market context.
| Bullish patterns | Bearish patterns | Main idea |
|---|---|---|
| Hammer | Shooting Star | Rejection candle after an extended move. |
| Bullish Engulfing | Bearish Engulfing | Strong candle shifts control from one side to the other. |
| Morning Star | Evening Star | Three-candle reversal structure. |
| Tweezer Bottom | Tweezer Top | Repeated defense or rejection of the same level. |
| Three White Soldiers | Three Black Crows | Strong directional momentum over several candles. |
8. Continuation Patterns vs Reversal Patterns
A reversal pattern suggests price may change direction. A continuation pattern suggests price may pause briefly and then continue in the same direction. Beginners often mistake every opposite-colored candle for a reversal, but trends can pull back without fully reversing.
| Type | Meaning | Examples | Best use |
|---|---|---|---|
| Reversal pattern | Suggests a possible change in direction. | Hammer, shooting star, engulfing, morning star, evening star. | Use near major support/resistance after a clear trend. |
| Continuation pattern | Suggests the trend may continue after a pause. | Inside bar breakout, rising three methods, falling three methods, strong marubozu continuation. | Use within a clear trend, after a healthy consolidation. |
9. How Timeframes Change Candlestick Signals
The same pattern can mean different things on different timeframes. A bullish engulfing candle on a 5-minute chart may only matter for a short scalp. A bullish engulfing candle on a weekly chart may reflect a much larger shift in market behavior. Higher timeframes usually carry more weight because they include more trading activity.
| Timeframe | Typical use | Main risk |
|---|---|---|
| 1-5 minutes | Scalping and very short-term trades. | High noise, fast losses, fees can matter a lot. |
| 15 minutes-1 hour | Intraday trading. | Still noisy; requires discipline and quick decisions. |
| 4 hours-daily | Swing trading and trend analysis. | Signals are slower but often clearer. |
| Weekly-monthly | Long-term market structure. | Can be too slow for active entries and exits. |
10. Candlestick Patterns Need Context
A candlestick pattern without context is like a word without a sentence. The same hammer can be useful, useless, or misleading depending on where it appears. Before trusting a pattern, check the following context factors.
- Trend: Is price making higher highs and higher lows, or lower highs and lower lows?
- Support and resistance: Is the pattern forming at a level where price previously reacted?
- Volume: Is the move supported by stronger trading activity or is it weak?
- Market condition: Is the market trending, ranging, or reacting to news?
- Liquidity: Is the asset actively traded, or can a small order move the price?
- Bitcoin influence: Many altcoins follow Bitcoin sentiment, so check the broader market too.
11. Volume Confirmation: A Simple but Important Filter
Volume shows how much trading activity occurred during a candle. A bullish engulfing pattern with higher-than-average volume is usually more meaningful than the same pattern with very low volume. Low volume can make patterns less reliable because price may move easily in thin markets.
A simple beginner rule is: if a candle claims to show strong momentum, volume should ideally support that claim. If price breaks above resistance but volume is weak, be cautious. It could be a false breakout.
12. Common Candlestick Mistakes in Crypto Trading
- Trading every pattern you see. Good trading is selective. Most candles are noise.
- Ignoring the trend. A bullish pattern in a strong downtrend can fail quickly.
- Buying before the candle closes. An unfinished candle can change shape dramatically before the period ends.
- Using patterns without stop-loss planning. A pattern is not a risk management plan.
- Ignoring fees and slippage. Frequent trading can become expensive, especially on small accounts.
- Using too much leverage. A correct idea can still be liquidated if the position is overleveraged.
- Forcing patterns. If the candle does not clearly match the pattern, do not pretend it does.
- Relying only on social media screenshots. Always check the chart, timeframe, volume, and source yourself.
13. Practical Trading Framework for Candlestick Patterns
Beginners need a repeatable process more than a long list of pattern names. Here is a simple framework that can make candlestick analysis more practical.
- Start with the market structure. Decide whether the chart is trending up, trending down, or moving sideways.
- Mark obvious support and resistance. Use previous swing highs, swing lows, consolidation zones, and round numbers.
- Wait for a pattern at a meaningful area. Do not trade patterns in the middle of nowhere.
- Confirm the signal. Use volume, the next candle close, trendline breaks, moving averages, or momentum indicators.
- Define invalidation. Know exactly where the pattern is wrong. For example, a hammer near support may be invalid if price closes below the hammer low.
- Calculate risk before entry. Decide how much of your account you are willing to risk. Many beginners risk too much per trade.
- Plan the exit. Set a target, trailing stop idea, or rule for taking partial profits.
- Review the trade afterward. Record whether the pattern worked, why it worked or failed, and what you learned.
14. Risk Management: The Part Most Beginners Skip
Candlestick patterns can help with timing, but risk management decides whether a trader survives long enough to improve. Crypto markets can move violently, and even strong-looking patterns fail.
14.1 Useful Risk Rules
- Risk only a small percentage of your account on any single trade.
- Use stop-losses based on invalidation, not emotion.
- Avoid leverage until you understand liquidation, funding fees, volatility, and position sizing.
- Do not average down blindly after a failed pattern.
- Avoid trading illiquid coins where spreads and slippage are high.
- Never risk money needed for rent, bills, debt payments, or emergency savings.
- Understand that technical analysis cannot protect you from exchange outages, hacks, sudden news, or regulatory shocks.
14.2 Example Risk Calculation
Suppose your trading account is $1,000 and you decide to risk 1% on a trade. Your maximum risk is $10. If you buy a crypto asset at $100 and your stop-loss is at $95, the risk per unit is $5. That means you can buy 2 units because 2 x $5 = $10 risk. This simple calculation helps prevent one bad trade from damaging your account too much.
15. Candlestick Patterns and Fees
Fees matter because many candlestick strategies involve frequent entries and exits. Crypto traders may pay trading fees, spread costs, withdrawal fees, network fees, funding fees on perpetual futures, and slippage. A strategy that looks profitable on a chart may perform poorly after costs.
| Cost | What it means | Why it matters |
|---|---|---|
| Trading fee | Fee charged by the exchange for each buy or sell. | Frequent trading increases total costs. |
| Spread | Difference between the best buy and sell price. | Wider spreads make entries and exits worse. |
| Slippage | Difference between expected price and actual fill price. | High during volatility or low liquidity. |
| Funding fee | Periodic payment on perpetual futures. | Can reduce profits or increase losses. |
| Network/withdrawal fee | Cost to move crypto on-chain or withdraw. | Important for small balances and active transfers. |
16. Best Indicators to Combine with Candlestick Patterns
Indicators should not be added just to make a chart look professional. Use each tool for a clear reason.
| Tool | What it helps with | Simple use |
|---|---|---|
| Support and resistance | Key price zones. | Look for candlestick signals at important levels. |
| Volume | Confirmation of activity. | Prefer breakouts and reversals with stronger volume. |
| Moving averages | Trend direction and dynamic support/resistance. | Use 50-period and 200-period averages to understand trend bias. |
| RSI | Momentum and overbought/oversold conditions. | Watch for divergence near support or resistance. |
| ATR | Volatility measurement. | Use it to set realistic stop-loss distances. |
17. Real-World Scenario: Planning a Candlestick-Based Trade
Here is a beginner-friendly example. Assume a crypto asset has been in an uptrend and pulls back to a previous support zone. A hammer forms on the 4-hour chart, and volume is slightly above average. The next candle closes above the hammer high.
A possible plan could be: enter only after confirmation, place the stop below the hammer low, target the previous swing high, and risk no more than a fixed amount of the account. This does not guarantee a winning trade. It simply turns a chart observation into a defined plan with an entry, invalidation point, and risk limit.
A poor plan would be: buy immediately because someone on social media said it is a hammer, use high leverage, skip the stop-loss, and hope the price goes up. The difference is not the pattern. The difference is process and risk control.
18. Pros and Cons of Candlestick Patterns in Crypto
| Pros | Cons |
|---|---|
| Easy to learn visually. | Can produce many false signals. |
| Useful across different timeframes. | Less reliable in low-liquidity coins. |
| Helps identify buyer/seller pressure. | Can be subjective if traders force patterns. |
| Works well with support, resistance, and volume. | Does not account for sudden news or exchange problems. |
| Can improve entry and exit planning. | Not a complete trading system by itself. |
19. Best Practices for Beginners
- Learn a small number of patterns deeply instead of memorizing dozens.
- Start with daily and 4-hour charts before lower timeframes.
- Always wait for the candle to close before judging the pattern.
- Use support, resistance, trend, and volume for confirmation.
- Write down your trade plan before entering.
- Backtest patterns on historical charts before risking real money.
- Practice on a demo or small size first.
- Keep a trading journal with screenshots and notes.
- Avoid trading during major news events if you do not understand the risk.
- Treat candlestick analysis as probability, not certainty.
20. Quick Reference Checklist
Before trading a candlestick pattern, ask these questions:
- Is the pattern clear, or am I forcing it?
- What timeframe am I using?
- Is the pattern forming near support, resistance, or a trend level?
- Does volume confirm the move?
- Has the candle closed?
- Where is the invalidation level?
- What is my stop-loss?
- What is my target or exit rule?
- How much am I risking?
- What could make this setup fail?
21. FAQs About Candlestick Patterns for Crypto
21.1 Are candlestick patterns reliable in crypto?
They can be useful, but they are not fully reliable. Crypto markets are volatile and can produce false signals. Candlestick patterns work best when combined with trend, support and resistance, volume, and risk management.
21.2 What is the best candlestick pattern for crypto beginners?
There is no single best pattern. Beginners can start with doji, hammer, shooting star, bullish engulfing, bearish engulfing, morning star, and evening star because these are common and easy to understand.
21.3 Should I trade a candle before it closes?
Beginners should usually wait for the candle to close. An unfinished candle can look bullish or bearish during the period and then change completely before closing.
21.4 Which timeframe is best for candlestick patterns?
Higher timeframes such as 4-hour and daily charts are often easier for beginners because they contain less noise than 1-minute or 5-minute charts. Short timeframes require faster decisions and stronger discipline.
21.5 Do candlestick patterns work on Bitcoin and altcoins?
They can be applied to Bitcoin, Ethereum, and altcoins, but liquidity matters. Patterns on major assets are generally more meaningful than patterns on thinly traded coins with wide spreads.
21.6 Can candlestick patterns predict the next crypto bull market?
No. Candlesticks can show price behavior, but they cannot predict long-term market cycles with certainty. Macro conditions, regulation, liquidity, adoption, token supply, and market sentiment also matter.
21.7 What is the difference between a hammer and a shooting star?
A hammer has a long lower wick and often appears after a decline, suggesting buyers rejected lower prices. A shooting star has a long upper wick and often appears after a rally, suggesting sellers rejected higher prices.
21.8 Is volume necessary for candlestick analysis?
Volume is not mandatory, but it is very helpful. Strong volume can confirm that a breakout or reversal has real participation. Weak volume can warn that a move may fail.
21.9 Can I use candlestick patterns for long-term investing?
Long-term investors can use weekly or monthly candles to understand market structure, but they should not rely only on patterns. Fundamentals, risk tolerance, diversification, and time horizon also matter.
21.10 What is the biggest mistake beginners make with candlesticks?
The biggest mistake is treating patterns as guaranteed signals. Candlesticks are clues, not certainties. A good trading plan includes confirmation, position sizing, stop-losses, and review.
22. Conclusion
Candlestick patterns for crypto are useful because they turn raw price movement into visual information. They can help beginners understand momentum, hesitation, rejection, support, resistance, and possible trend changes. But candlesticks are not magic signals. They are best used as part of a complete process that includes market context, volume confirmation, risk management, fees, and emotional discipline.
A beginner who learns fewer patterns, waits for confirmation, controls risk, and reviews trades honestly will usually build a stronger foundation than someone who memorizes many patterns but trades impulsively. Use candlesticks to ask better questions, not to chase guaranteed answers.
Sources Consulted and Checked
These sources were consulted and checked while preparing this document to support accuracy and responsible reader education.
- SEC Investor.gov: Exercise Caution with Crypto Asset Securities: Investor Alert.
- CFTC: Understand the Risks of Virtual Currency Trading.
- FINRA: Crypto Assets and Crypto Assets Risks investor education pages.
Reader Advice
Candlestick patterns can help organize price information, but they cannot predict the future with certainty. Crypto markets are volatile, speculative, and can move sharply because of news, liquidity changes, exchange issues, leverage, hacks, regulations, token unlocks, or social media hype. Official investor education resources from the SEC, CFTC, and FINRA warn that crypto assets can be highly volatile, risky, and vulnerable to fraud or scams. Use this article for education only, not as a recommendation to buy, sell, or trade any crypto asset.
Disclaimer: This document is for educational purposes only and does not provide financial, investment, legal, or tax advice. Always do your own research and consider consulting a qualified professional before making financial decisions.
Crypto trading and investing involve substantial risk, including rapid price swings, loss of capital, liquidation when leverage is used, fraud, scams, exchange failures, cybersecurity incidents, liquidity problems, fees, slippage, and regulatory changes. Candlestick patterns are analytical clues rather than guarantees and should not be used as the sole basis for a financial decision. Rules, exchange policies, laws, tax treatment, market practices, and statistics can change over time and vary by country or region, so please verify current information through official regulators, exchange documentation, and other authoritative sources. Consider your objectives, experience, financial circumstances, and risk tolerance, and seek advice from an appropriately qualified professional where needed. Never trade with money required for essential expenses or emergencies.