How to Read Crypto Charts: Step-by-Step Guide, Tips, Fees, Risks and Best Practices
Crypto charts can look confusing at first. There are red and green candles, moving lines, volume bars, timeframes, indicators, order books, and price levels that seem to change every second. The good news is that you do not need to master everything on day one. A useful crypto chart reading process starts with a few simple questions: What is the price doing? Where has price reacted before? Is volume supporting the move? What is the risk if the idea is wrong?
Reading crypto charts means using price, time, volume, and market structure to understand what buyers and sellers are doing. It does not mean predicting the future with certainty. A chart is a decision-making tool, not a crystal ball. The best traders use charts to build a plan, manage risk, and avoid emotional decisions.
2. What Is a Crypto Chart?
A crypto chart is a visual record of how the price of a cryptocurrency has moved over time. For example, a BTC/USDT chart shows the price of Bitcoin measured in Tether. An ETH/USD chart shows the price of Ether measured in U.S. dollars. Most charts show price on the vertical axis and time on the horizontal axis.
Charts help you see patterns that are hard to understand from a list of numbers. You can quickly identify whether price is rising, falling, moving sideways, reacting to an old level, or moving with unusually high volume.
| Chart element | What it means | Beginner example |
|---|---|---|
| Trading pair | The asset being traded and the currency it is priced in. | BTC/USDT means Bitcoin priced in USDT. |
| Timeframe | How much time each candle or bar represents. | 1H means each candle shows one hour of trading. |
| Price scale | The price level shown on the chart. | BTC at 65,000 USDT. |
| Volume | How much was traded during the period. | A breakout with high volume may be stronger than one with low volume. |
| Indicators | Optional tools added to the chart. | Moving averages, RSI, MACD, Bollinger Bands. |
3. Line Charts vs Candlestick Charts vs Bar Charts
Most beginners start with line charts because they are simple. However, most active traders use candlestick charts because they show more information about each time period.
| Chart type | Best for | Main limitation |
|---|---|---|
| Line chart | Quickly seeing general direction. | Usually shows only closing prices, so it hides intraperiod movement. |
| Candlestick chart | Reading open, high, low, close, momentum, and price rejection. | Can feel busy at first and can lead to overinterpretation. |
| Bar chart | Viewing open, high, low, close in a compact format. | Less visually intuitive for many beginners. |
| Heikin-Ashi chart | Smoothing trend direction. | Uses modified values, so it may hide exact market prices. |
4. How to Read a Crypto Candlestick
A candlestick summarizes price action during one chosen period. If your chart is set to 15 minutes, each candle shows what happened during 15 minutes. If your chart is set to one day, each candle shows one full day.
| Candlestick part | Meaning |
|---|---|
| Open | The first traded price during that candle period. |
| High | The highest traded price during that period. |
| Low | The lowest traded price during that period. |
| Close | The final traded price when the candle period ended. |
| Body | The distance between open and close. A large body shows strong movement. |
| Wick or shadow | The thin line above or below the body. It shows price rejection or intraperiod extremes. |
A green candle usually means the close was higher than the open. A red candle usually means the close was lower than the open. The color alone is not enough. A small green candle after a large drop may not be bullish. A red candle with a long lower wick may show that sellers pushed price down but buyers stepped in before the close.
4.1 Simple Candlestick Examples Beginners Should Know
| Candle pattern | What it may suggest | How to use it carefully |
|---|---|---|
| Long green candle | Strong buying pressure during that period. | Check whether it breaks a key level with volume or appears after an overextended move. |
| Long red candle | Strong selling pressure. | Check whether it breaks support or is only a temporary pullback. |
| Doji | Indecision because open and close are close together. | Do not trade a doji alone. Look at trend, level, and volume. |
| Hammer-like candle | Sellers pushed down, but buyers recovered much of the move. | More useful near support after a decline than randomly in the middle of a range. |
| Shooting star-like candle | Buyers pushed up, but sellers rejected the move. | More meaningful near resistance after a rally. |
| Engulfing candle | A strong candle fully overtakes the previous candle body. | Use as a possible momentum clue, not guaranteed reversal proof. |
5. Step-by-Step: How to Read Crypto Charts
Use this process each time you open a chart. It keeps you focused and helps avoid random decisions based on excitement or fear.
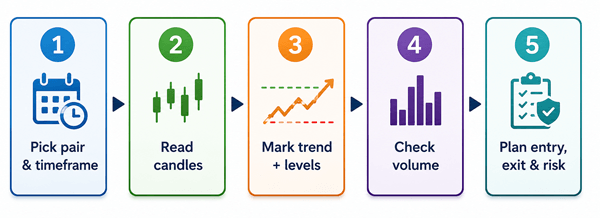
5.1 Choose the Right Trading Pair
Start by confirming the exact pair. BTC/USDT, BTC/USD, and BTC/ETH are different charts. A coin may look strong against the U.S. dollar but weak against Bitcoin. Beginners usually find stablecoin or fiat pairs easier to understand because the quote currency is simpler.
- Use high-liquidity pairs when learning, such as BTC/USDT or ETH/USDT on reputable exchanges.
- Avoid tiny low-volume coins until you understand spreads, slippage, and manipulation risk.
- Check that you are viewing the same exchange where you plan to trade because prices can differ slightly across platforms.
5.2 Select a Timeframe
The timeframe changes the story. A coin can look bullish on a 15-minute chart but bearish on a daily chart. Beginners often make mistakes because they enter on a small timeframe while ignoring the larger trend.
| Timeframe | Useful for | Beginner warning |
|---|---|---|
| 1m to 5m | Very short-term scalping. | Noisy, fast, stressful, and fee-sensitive. |
| 15m to 1H | Intraday trading and short-term setups. | Can produce many false signals. |
| 4H | Swing trading and cleaner structure. | Signals take longer to form. |
| 1D | Big trend, important support/resistance, investor context. | Not ideal for precise short-term entries. |
| 1W | Long-term market cycles. | Too slow for active trading decisions. |
5.3 Identify the Trend
A trend shows the general direction of price. In an uptrend, price often makes higher highs and higher lows. In a downtrend, price often makes lower highs and lower lows. In a sideways market, price moves between support and resistance without clear direction.
- Uptrend: buyers keep stepping in at higher prices.
- Downtrend: sellers keep stepping in at lower prices.
- Range: price moves between a ceiling and a floor.
- Transition: price stops making clean highs or lows and becomes choppy.
A simple beginner method is to zoom out, mark the major swing highs and lows, and ask: are these levels rising, falling, or flat? Do this before adding indicators.
5.4 Mark Support and Resistance
Support is an area where price has previously found buyers. Resistance is an area where price has previously found sellers. These are zones, not exact magic lines. In crypto, price often briefly wicks above or below a level before reversing.
| Level type | What it means | Example |
|---|---|---|
| Support | A price area where buyers may defend the market. | ETH falls to 3,000 several times and bounces. |
| Resistance | A price area where sellers may appear. | BTC rises to 70,000 several times and fails. |
| Breakout | Price moves beyond a key level. | BTC closes above 70,000 after repeated rejection. |
| Retest | Price returns to the broken level to test it again. | Old resistance near 70,000 acts as new support. |
| Fakeout | Price breaks a level briefly, then reverses. | A candle wicks above resistance but closes back below it. |
5.5 Check Volume
Volume shows how much trading activity happened during a candle. Volume does not guarantee direction, but it helps judge the strength behind a move. A breakout with rising volume is usually more convincing than a breakout on weak volume. A price rise with declining volume may suggest that fewer buyers are participating.
- Rising price + rising volume can show strong demand.
- Falling price + rising volume can show strong selling pressure.
- Breakout + low volume can be a warning sign.
- Large volume at support or resistance may signal a battle between buyers and sellers.
5.6 Use Moving Averages for Context
A moving average smooths price data to show general direction. Common examples are the 20-period, 50-period, and 200-period moving averages. They are not perfect signals, but they help beginners avoid fighting the larger trend.
| Moving average | Common use | Beginner interpretation |
|---|---|---|
| 20 MA/EMA | Short-term momentum. | Price above it may show short-term strength. |
| 50 MA/EMA | Medium-term trend. | Often watched by swing traders. |
| 200 MA/EMA | Long-term trend filter. | Price above it may suggest stronger long-term structure; below it may suggest caution. |
A common mistake is buying only because price touches a moving average. A better approach is to combine moving averages with trend, support/resistance, volume, and risk management.
5.7 Understand Momentum Indicators
Indicators are tools, not answers. They can help you see momentum, volatility, or trend strength, but they often lag behind price. Beginners should start with one or two indicators rather than filling the chart with many conflicting signals.
| Indicator | What it helps measure | Beginner use |
|---|---|---|
| RSI | Momentum and possible overbought/oversold conditions. | Look for extreme readings near important levels, not automatic buy/sell signals. |
| MACD | Trend momentum and changes in momentum. | Useful for spotting momentum shifts, but can lag in fast crypto moves. |
| Bollinger Bands | Volatility and price expansion/contraction. | A squeeze may show low volatility before a larger move, but direction is not guaranteed. |
| VWAP | Average traded price weighted by volume. | Often used intraday to judge whether price is trading above or below the session average. |
5.8 Build a Trade Idea Before Entering
A chart only becomes useful when it leads to a plan. A beginner trade plan should answer five questions before any order is placed:
- What is the trend on the higher timeframe?
- Where is the nearest support and resistance?
- What condition must happen before entry?
- Where is the trade idea wrong?
- What is the target and is the reward worth the risk?
Example: BTC is in a 4-hour uptrend. Price pulls back to previous resistance that may now act as support. Volume decreases during the pullback, then a strong green candle forms from the level. A trader may plan a long entry above that candle, stop-loss below the support zone, and target the prior swing high. This is not guaranteed to work, but it is a plan with defined risk.
6. Practical Example: Reading a BTC/USDT Chart
Imagine BTC/USDT has been rising from 62,000 to 68,000. It then pulls back to 65,000, where it bounced twice before. The 4-hour chart still shows higher highs and higher lows. Volume during the pullback is lower than during the previous rally. A candle forms with a long lower wick at 65,000 and closes near 66,000.
A beginner could read this as: the broader trend is still upward, 65,000 is a support zone, sellers pushed price down but buyers defended the area, and the low-volume pullback may show reduced selling pressure. However, the trade is still risky. If BTC closes below 65,000 with high volume, the support idea is likely weaker.
| Decision point | Good chart-reading question |
|---|---|
| Trend | Is the 4-hour or daily chart still making higher highs and higher lows? |
| Support | Has price reacted near 65,000 before? |
| Volume | Did volume increase on the bounce or on the breakdown? |
| Entry | Is there a clear trigger, or am I chasing? |
| Invalidation | At what price is my trade idea wrong? |
| Fees | Will fees and spread make this setup too expensive? |
7. Crypto Chart Patterns Beginners Often See
Chart patterns are visual structures formed by price movement. They can be useful, but they are not guaranteed. A pattern should be supported by context, volume, and risk management.
| Pattern | Basic meaning | Common mistake |
|---|---|---|
| Higher highs and higher lows | Uptrend structure. | Buying after the move is already overextended. |
| Lower highs and lower lows | Downtrend structure. | Trying to catch the bottom too early. |
| Range | Price moves between support and resistance. | Buying resistance or selling support. |
| Breakout | Price escapes a range or key level. | Entering before candle close and getting trapped by a fakeout. |
| Ascending triangle | Flat resistance with rising lows, often watched for breakout. | Assuming it must break upward. |
| Head and shoulders | Possible trend reversal pattern. | Forcing the pattern when the structure is unclear. |
8. Fees: Why Chart Reading Must Include Trading Costs
Fees matter because every trade starts at a small disadvantage. The more frequently you trade, the more fees and spread can reduce your returns. This is especially important on low timeframes where profit targets may be small.
Most crypto exchanges use maker and taker fees. A taker order fills immediately against existing liquidity, such as a market order. A maker order usually sits on the order book first, such as a limit order that does not immediately fill. Many exchanges charge different maker and taker rates, and the exact rates can change based on volume, region, product, and account tier.
| Cost type | What it means | Why it matters |
|---|---|---|
| Trading fee | Exchange charge for executing a trade. | Frequent trading can become expensive. |
| Spread | Difference between best buy and sell price. | Thin markets can cost more even if the visible fee looks low. |
| Slippage | Difference between expected and actual fill price. | Market orders in volatile coins may fill worse than expected. |
| Funding rate | Periodic payment on perpetual futures. | Can become costly if holding leveraged positions. |
| Withdrawal fee/network fee | Cost to move crypto off the exchange. | Can affect small accounts and frequent transfers. |
| Tax/reporting cost | Record-keeping and potential tax impact. | Every trade may create reporting obligations depending on your jurisdiction. |
Example fee calculation: suppose you buy $1,000 of crypto with a 0.10% trading fee. The entry fee is $1. If you later sell the full position with another 0.10% fee, the exit fee is about $1, not counting spread or slippage. A small 0.2% price move may be mostly consumed by round-trip fees. This is why very short-term trading is harder than it looks.
9. Risk Management: The Most Important Part of Chart Reading
Good chart reading does not protect you from losses unless you manage risk. In crypto, a technically correct setup can fail quickly because of news, liquidations, low liquidity, exchange outages, or sudden volatility.
| Risk rule | Practical beginner version |
|---|---|
| Define invalidation | Know the price level that proves your idea wrong. |
| Use position sizing | Risk a small fixed percentage of your account rather than guessing. |
| Avoid excessive leverage | Leverage magnifies both gains and losses and can liquidate the position. |
| Plan before entry | Entry, stop, target, and trade reason should be written before the trade. |
| Do not average down blindly | Adding to a losing trade can turn a small mistake into a major loss. |
| Keep records | A trading journal helps reveal repeated mistakes. |
9.1 Simple Position Sizing Example
Suppose your trading account is $2,000 and you decide to risk 1% on one trade. That means your maximum planned loss is $20. If your entry is $100 and your stop-loss is $96, the risk per coin is $4. You would buy 5 coins because $20 divided by $4 equals 5. The position value is $500, but the planned risk is $20 before fees and slippage.
This is very different from putting your whole account into a trade and hoping the chart is right. Beginners should think in terms of risk first, profit second.
10. Common Beginner Mistakes When Reading Crypto Charts
| Mistake | Why it is dangerous | Better habit |
|---|---|---|
| Using too many indicators | Conflicting signals create confusion. | Start with price, trend, levels, volume, and one or two indicators. |
| Ignoring higher timeframes | A small bullish signal can fail inside a larger downtrend. | Check daily or 4-hour context before entering lower timeframe trades. |
| Chasing green candles | Entering late often creates poor risk/reward. | Wait for a plan, pullback, breakout close, or retest. |
| Trading illiquid coins | Spreads, slippage, and manipulation risk are higher. | Prefer liquid markets while learning. |
| Believing every pattern | Patterns fail often, especially in volatile markets. | Use confirmation and defined invalidation. |
| Ignoring fees | Small trades can become unprofitable after costs. | Calculate round-trip fees before entering. |
| No stop-loss plan | One bad trade can damage the account. | Know where the idea is wrong before entry. |
11. Best Practices for Reading Crypto Charts
- Start from the higher timeframe, then move down to the entry timeframe.
- Mark only the most obvious support and resistance zones; too many lines reduce clarity.
- Use candle closes, not only wicks, to judge breakouts.
- Check volume during breakouts, breakdowns, and reversals.
- Avoid trading immediately after major news unless you understand volatility risk.
- Keep charts clean. A simple chart read well is better than a crowded chart read poorly.
- Write down the reason for every trade before entering.
- Review losing trades without emotion to see whether the setup, execution, or risk management failed.
- Remember that no indicator works in every market condition.
- Use demo or very small trades while learning.
12. Pros and Cons of Using Crypto Charts
| Pros | Cons |
|---|---|
| Helps organize price information visually. | Can create false confidence if treated as prediction. |
| Useful for identifying trend, levels, and volatility. | Signals can fail quickly in crypto markets. |
| Supports disciplined planning and risk management. | Beginners may overtrade when watching charts constantly. |
| Works across many coins and timeframes. | Low-liquidity coins can make chart signals unreliable. |
| Can be combined with fundamental research. | Past price action does not guarantee future results. |
13. A Beginner Crypto Chart Reading Checklist
Before placing a trade, run through this checklist:
- Which pair and exchange am I looking at?
- What is the higher-timeframe trend?
- Where are the nearest support and resistance zones?
- Is price in a trend, range, breakout, or pullback?
- Is volume confirming or weakening the move?
- What indicator, if any, supports the idea?
- Where is my entry trigger?
- Where is my stop-loss or invalidation level?
- What is the target and reward-to-risk ratio?
- Have I included fees, spread, and possible slippage?
- Is this trade planned, or am I reacting emotionally?
14. Frequently Asked Questions
14.1 What is the easiest way to read crypto charts as a beginner?
Start with a candlestick chart on a larger timeframe such as 4H or 1D. Identify the trend, mark major support and resistance, check volume, and avoid adding too many indicators. Focus on understanding what price is doing before trying advanced strategies.
14.2 Are crypto charts reliable?
Crypto charts can be useful, but they are not fully reliable. They show historical price behavior and help build trade plans, but they cannot predict the future. News, liquidity, exchange issues, and market sentiment can invalidate chart setups quickly.
14.3 What is the best timeframe for beginners?
Many beginners do better with 4H and daily charts because they are less noisy than 1-minute or 5-minute charts. Short timeframes require faster decisions and are more sensitive to fees and slippage.
14.4 Do I need indicators to read charts?
No. You can learn a lot from price action, trend, support, resistance, and volume. Indicators can help, but too many indicators often confuse beginners.
14.5 What is support and resistance in crypto?
Support is a price area where buyers have previously appeared. Resistance is a price area where sellers have previously appeared. These are zones, not exact guaranteed levels.
14.6 What does volume mean on a crypto chart?
Volume shows how much trading activity happened during a period. High volume during a breakout can suggest stronger participation, while low volume can make a move less convincing.
14.7 Can I make money just by reading charts?
Chart reading can improve decision-making, but it does not guarantee profits. Long-term results depend on risk management, discipline, fees, market conditions, and avoiding emotional decisions.
14.8 Why do breakouts fail in crypto?
Breakouts fail because traders may chase price, large players may trigger stops, volume may be weak, or the market may quickly reverse due to news or liquidity changes. Waiting for candle close and retests can reduce some false-breakout risk, but not eliminate it.
14.9 Should beginners use leverage?
Most beginners should avoid leverage. Leverage can magnify losses and cause liquidation even when the general trade idea later becomes correct.
14.10 How do fees affect chart-based trading?
Fees, spread, and slippage reduce net profit. Short-term trades with small targets can become unprofitable after costs, even if the chart direction was correct.
15. Final Thoughts
Learning how to read crypto charts is not about finding a secret signal. It is about building a repeatable process. Start with the pair and timeframe. Understand each candle. Identify trend, support, resistance, and volume. Use indicators lightly. Plan entries and exits before trading. Most importantly, manage risk because every setup can fail.
A beginner who reads a simple chart carefully, calculates fees, avoids overtrading, and protects capital is already ahead of many traders who use complicated indicators without a plan. Treat chart reading as a skill that improves with practice, review, and patience.
Sources Consulted and Checked
These sources were consulted and checked while preparing this document to support clarity and accuracy.
- TradingView Support - volume candles and OHLC chart information
- Coinbase Help - Advanced Trade maker and taker fee explanation
- Coinbase Help - Coinbase Exchange fees
- Binance - official fee schedule
- U.S. Securities and Exchange Commission Investor.gov - crypto asset risk resources
Reader Advice
This article is provided for educational and informational purposes only and is not personalized financial, investment, legal, tax, or trading advice. Crypto assets and leveraged products can be highly volatile, and losses may occur quickly, including the possible loss of the full amount committed. Fees, exchange terms, market conditions, laws, regulations, policies, and statistics can change over time and may vary by country or region. Before making a decision, verify current information through official exchange, regulator, and tax-authority sources, assess whether the risks suit your circumstances, and consider guidance from an appropriately qualified professional.