Support and Resistance in Crypto: Complete Guide
Support and resistance are two of the most useful ideas in technical analysis. They help traders understand where price has previously struggled to move lower or higher. In crypto, these levels can be especially important because prices often move quickly, liquidity can change fast, and emotions such as fear and greed can drive sharp swings.
This guide explains support and resistance in crypto from the ground up. You will learn what these levels mean, how to identify them on a chart, how traders use them, where beginners often go wrong, and how to build safer habits before risking real money.
1. What Are Support and Resistance in Crypto?
Support is a price area where buying interest has been strong enough in the past to slow, stop, or reverse a decline. It is often thought of as a floor, but it is better to think of it as a zone where buyers may become more active.
Resistance is a price area where selling pressure has previously been strong enough to slow, stop, or reverse an advance. It is often described as a ceiling, but in practice it is also a zone, not a perfect line.
| Term | Simple meaning | What it suggests |
|---|---|---|
| Support | An area where price has bounced before | Buyers may defend this area again, but it can still break |
| Resistance | An area where price has been rejected before | Sellers may appear again, but price can break above it |
| Breakout | Price moves and closes above resistance | Buying pressure may be gaining strength |
| Breakdown | Price moves and closes below support | Selling pressure may be gaining strength |
| Retest | Price returns to a broken level | Traders watch whether the old level now acts differently |
For example, if Bitcoin falls several times toward $60,000 and then bounces, many traders may begin watching the $60,000 area as support. If Ethereum rallies several times toward $4,000 and fails to move above it, traders may treat the $4,000 area as resistance.
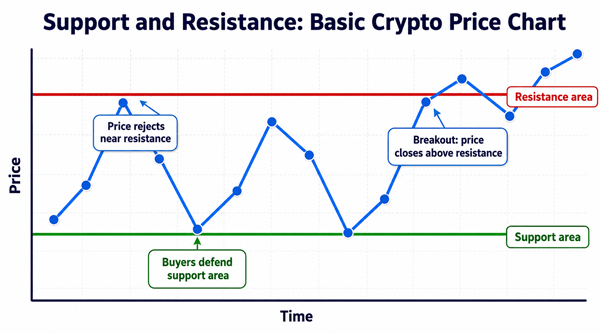
Diagram: A simplified crypto chart showing support, resistance, rejection, and breakout behavior.
2. Why Support and Resistance Matter in Crypto
Support and resistance matter because markets are shaped by decisions. Every price level reflects people buying, selling, taking profits, cutting losses, entering late, or waiting for confirmation. When many traders remember the same level, that area can influence future behavior.
- They help beginners understand where price may react, instead of guessing randomly.
- They provide structure for planning entries, exits, stop-loss areas, and profit targets.
- They can help traders avoid buying directly under obvious resistance or selling directly above obvious support.
- They make it easier to compare bullish, bearish, and sideways market conditions.
However, support and resistance do not predict the future with certainty. They are decision areas, not guarantees. A level that worked many times can fail suddenly if market conditions change.
3. How Support and Resistance Work
Support and resistance work because of supply, demand, memory, and emotion. When price returns to a previous turning point, different groups of market participants may react.
3.1 Buyer and Seller Behavior
At support, buyers may think the asset is relatively cheaper than before, short sellers may take profit, and traders who missed the last bounce may try to enter. At resistance, holders may take profit, short sellers may enter, and late buyers may become cautious.
3.2 Market Memory
If a coin bounced strongly from $1.00, many traders remember that area. Some place buy orders near it. Others place stop-loss orders below it. This cluster of decisions can create a visible reaction when price returns.
3.3 Liquidity and Stop Orders
Crypto markets often move toward areas where many stop orders or breakout orders are placed. A sharp move through support or resistance can trigger a chain reaction. That is why breakouts can accelerate, and false breakouts can reverse quickly.
4. Support and Resistance Are Zones, Not Exact Lines
One of the biggest beginner mistakes is drawing a thin line and expecting price to respect it exactly. Real markets are messy. Price may briefly move above or below a level, wick through it, or test nearby prices before reacting.
A better approach is to mark a support or resistance zone. A zone may include candle bodies, wicks, previous highs or lows, and areas where price spent time consolidating.
| Exact line thinking | Zone thinking |
|---|---|
| Price must reverse at exactly $100.00 | Price may react around the $98-$102 area |
| A wick below support means support failed | A close below the zone is more meaningful |
| One touch is enough proof | Multiple reactions or strong volume give better context |
| Every level is equally important | Levels from higher time frames usually matter more |
5. Types of Support and Resistance in Crypto
| Type | What it means | Beginner example |
|---|---|---|
| Horizontal support/resistance | A flat price area where price repeatedly reacts | BTC bouncing around the same price zone several times |
| Trendline support/resistance | A diagonal line connecting rising lows or falling highs | ETH holding a rising trendline during an uptrend |
| Moving average support/resistance | Price reacting near a moving average such as the 50-day or 200-day average | A coin bouncing from its 200-day moving average |
| Psychological levels | Round numbers that traders naturally watch | $1, $10, $100, $1,000, $100,000 |
| Volume-based levels | Areas where a lot of trading happened | A price range with heavy previous trading activity |
| Previous all-time high or cycle high | A major historic level that many traders remember | A coin struggling near its former record high |
| Fibonacci levels | Common retracement levels used by technical traders | Price reacting near the 0.382, 0.5, or 0.618 retracement |
6. How to Identify Support and Resistance on a Crypto Chart
You do not need advanced tools to start. A simple candlestick chart with time frame options is enough. The goal is to find areas where price has reacted clearly in the past.
- Choose a clean chart. Remove unnecessary indicators at first so you can see price action clearly.
- Start with a higher time frame. Look at daily or weekly charts before shorter time frames. Higher-time-frame levels are usually more important.
- Mark obvious swing highs and swing lows. A swing high is a peak where price turned down. A swing low is a trough where price turned up.
- Look for repeated reactions. A level becomes more interesting when price reacts there more than once.
- Use zones instead of thin lines. Include nearby wicks and candle bodies rather than forcing one exact price.
- Check whether the level is recent and relevant. A level from years ago may matter, but a recent level often matters more for short-term trading.
- Look for confluence. A level is stronger when it matches other evidence, such as high volume, a trendline, or a moving average.
- Wait for price behavior near the level. Do not trade just because price is touching a line. Watch how candles close, how volume behaves, and whether the market confirms or rejects the level.
7. Practical Example: Finding Support and Resistance
Imagine a crypto token has traded like this over several weeks:
| Price action | What a beginner might notice |
|---|---|
| Price rises to $2.50, then falls | $2.50 may be resistance |
| Price later rises to $2.48, then falls again | $2.45-$2.55 looks like a resistance zone |
| Price falls to $1.80, then bounces | $1.80 may be support |
| Price later falls to $1.82, then bounces again | $1.75-$1.85 looks like a support zone |
| Price finally closes above $2.55 with strong volume | Possible breakout above resistance |
| Price returns to $2.50 and bounces | Old resistance may now act as new support |
This does not mean the next move is guaranteed. It means the chart has given you areas to watch and a logical way to plan.
8. Support Becoming Resistance and Resistance Becoming Support
A common idea in technical analysis is role reversal. When support breaks, it may become resistance later. When resistance breaks, it may become support later.
For example, if a coin holds support near $5.00 for weeks but then breaks below it, traders who bought near $5.00 may want to exit if price returns to that area. Their selling can turn old support into new resistance.
The reverse can happen after a breakout. If price breaks above $10.00 resistance and later pulls back, buyers may defend the old resistance area as new support.
9. Breakouts, Breakdowns, and False Moves
9.1 What Is a Breakout?
A breakout happens when price moves above a resistance area. Traders usually want to see a strong candle close above the zone, increased volume, and follow-through buying. A wick above resistance is weaker than a clear close above it.
9.2 What Is a Breakdown?
A breakdown happens when price moves below a support area. A stronger breakdown usually includes a clear candle close below the zone, rising selling volume, and failed attempts to reclaim support.
9.3 What Is a False Breakout?
A false breakout happens when price briefly moves beyond a level but quickly reverses. In crypto, false breakouts are common because of high leverage, thin liquidity on smaller coins, and stop-loss hunting around obvious levels.
| Signal | Stronger confirmation | Weaker confirmation |
|---|---|---|
| Breakout above resistance | Candle closes above the zone with volume | Only a brief wick above the line |
| Breakdown below support | Candle closes below the zone and retest fails | Price dips below and quickly recovers |
| Retest | Price returns to level and holds/rejects clearly | Price chops around with no clear direction |
| Volume | Volume expands during the move | Move happens on low or declining volume |
10. How Traders Use Support and Resistance
Support and resistance can be used in several ways. Beginners should focus on simple planning rather than trying to predict every move.
10.1 Planning Entries
Some traders look to buy near support when the market shows signs of holding. Others buy after a breakout above resistance. Both approaches have risks. Buying near support may fail if support breaks. Buying a breakout may fail if the breakout reverses.
10.2 Planning Exits and Profit Targets
Resistance can be used as a possible profit-taking area for long trades. Support can be used as a possible profit-taking area for short trades. For example, if you buy near $1.80 support and resistance is near $2.50, you may decide to take partial profit before or around the resistance zone.
10.3 Placing Stop-Loss Orders
A stop-loss is an order or plan to exit if the trade goes against you. Traders often place stops beyond support or resistance zones, not directly on the line. A stop placed too close may be triggered by normal volatility. A stop placed too far away may create too much risk.
10.4 Improving Risk-to-Reward
Support and resistance help traders compare the potential reward with the potential loss. A trade is usually less attractive if the entry is very close to resistance but far from support. A trade may be more attractive if the potential target is meaningfully larger than the planned risk.
11. Risk-to-Reward Example
Suppose a beginner is watching a coin near $10.00 support. Resistance is around $13.00. The trader considers buying at $10.20, with a stop-loss at $9.40.
| Item | Value |
|---|---|
| Entry price | $10.20 |
| Stop-loss | $9.40 |
| Risk per coin | $0.80 |
| Potential target | $13.00 |
| Potential reward per coin | $2.80 |
| Approximate reward-to-risk | 3.5 to 1 |
This setup may look attractive on paper, but the trader still needs confirmation, position sizing, and a plan for what to do if price moves sideways, breaks support, or fails before resistance.
12. Common Support and Resistance Trading Strategies
| Strategy | Basic idea | Best used when | Main risk |
|---|---|---|---|
| Bounce trade | Buy near support or sell near resistance after signs of rejection | Market is ranging or respecting levels | Support or resistance can break suddenly |
| Breakout trade | Enter after price closes above resistance | Market has strong momentum and volume | False breakout or late entry |
| Breakdown trade | Enter after price closes below support | Market is weakening and sellers are in control | Sharp reversal back above support |
| Retest trade | Wait for price to return to a broken level before entering | You want more confirmation than the initial breakout | Retest may never happen |
| Range trade | Buy near support and take profit near resistance inside a sideways range | Market is clearly moving sideways | Range eventually breaks |
13. Indicators That Can Support Your Analysis
Indicators should not replace price levels, but they can add context. Beginners should avoid using too many at once.
| Tool | How it helps | Beginner caution |
|---|---|---|
| Volume | Shows whether a move has strong participation | Volume varies by exchange, especially in crypto |
| Moving averages | Can act as dynamic support or resistance | Moving averages lag behind price |
| RSI | Can show overbought or oversold conditions | Overbought can stay overbought in strong trends |
| MACD | Can show momentum shifts | Signals can be late in fast markets |
| VWAP | Shows an average price weighted by volume, often used intraday | Less useful for long-term analysis |
| Fibonacci retracement | Highlights common pullback zones | Levels are not magic; use with other evidence |
14. Support and Resistance Across Different Time Frames
The time frame you use changes the meaning of a level. A support area on a weekly chart may matter to long-term investors. A support area on a 5-minute chart may only matter for short-term traders.
| Time frame | Best for | How beginners should use it |
|---|---|---|
| Weekly | Major market structure and long-term levels | Start here for important zones |
| Daily | Swing trading and broader trend context | Use to mark key support and resistance |
| 4-hour | Shorter-term setups and retests | Use after higher-time-frame levels are marked |
| 1-hour or lower | Intraday entries and exits | Use carefully; noise and false moves increase |
A useful habit is to start from the higher time frame and then move down. For example, mark weekly and daily support/resistance first, then use a 4-hour or 1-hour chart to refine entries. This reduces the risk of focusing only on short-term noise.
15. Crypto-Specific Challenges
Support and resistance can work in any liquid market, but crypto has special characteristics that beginners should understand.
- 24/7 trading: Crypto does not close for weekends or nights, so levels can break while you are away.
- High volatility: Normal crypto moves can be much larger than moves in many traditional markets.
- Exchange differences: Price and volume can vary across exchanges, especially for smaller coins.
- Leverage: Futures and margin trading can trigger liquidations that push price through obvious levels.
- News sensitivity: Regulatory headlines, exchange listings, hacks, token unlocks, ETF flows, and macro news can overwhelm technical levels.
- Lower liquidity on small coins: Thin order books can make support and resistance less reliable.
16. Benefits of Using Support and Resistance
- They simplify complex charts into clear areas of interest.
- They help beginners avoid random entries and emotional decisions.
- They support better risk planning and trade management.
- They can be used with many trading styles, including spot trading, swing trading, and intraday trading.
- They help identify whether a market is trending, ranging, breaking out, or breaking down.
17. Limitations and Risks
Support and resistance are helpful, but they have serious limitations. Treating them as guaranteed signals is dangerous.
| Risk or limitation | Why it matters | Better practice |
|---|---|---|
| False breakouts | Crypto often wicks beyond obvious levels | Wait for candle closes, retests, and volume confirmation |
| Subjective drawing | Different traders may draw different zones | Focus on obvious levels visible to many traders |
| Overcrowded levels | Too many traders watching the same level can create traps | Avoid placing stops exactly where everyone else may place them |
| News shocks | Major news can invalidate technical levels instantly | Reduce size or avoid trading during major events |
| Low-liquidity coins | Levels can break easily because order books are thin | Prefer liquid assets if you are a beginner |
| Overfitting | Drawing too many lines makes every move look meaningful | Keep only the clearest levels |
18. Beginner Mistakes to Avoid
- Drawing too many levels. If your chart is covered in lines, you have no clear plan.
- Treating support and resistance as exact prices. Use zones, not perfect lines.
- Ignoring the trend. Buying support in a strong downtrend is riskier than buying support in an uptrend.
- Entering before confirmation. Price touching support does not automatically mean it will bounce.
- Using only one time frame. A 15-minute support level may be weak if the daily chart is breaking down.
- Putting stop-loss orders too close. Crypto volatility can trigger tight stops easily.
- Risking too much on one trade. Even a good setup can fail.
- Confusing a wick with a confirmed breakout. Candle closes usually matter more than brief spikes.
- Ignoring volume and liquidity. A breakout on weak volume may fail quickly.
- Chasing after a big move. Buying far above support and directly under resistance can create poor risk-to-reward.
19. Best Practices for Using Support and Resistance in Crypto
- Start with higher time frames and mark only the clearest levels.
- Use zones that include wicks, candle bodies, and previous reaction areas.
- Wait for confirmation such as strong closes, retests, or volume expansion.
- Plan your entry, stop-loss, target, and position size before entering.
- Avoid trading every touch. Focus on high-quality setups with good risk-to-reward.
- Keep a trading journal. Record your levels, reasons for entry, result, and lesson learned.
- Practice on paper or with small size before using meaningful capital.
- Use alerts instead of staring at charts all day.
- Avoid heavy leverage, especially as a beginner.
- Remember that protecting capital is more important than being right.
20. Simple Checklist Before Taking a Trade
| Question | Why it matters |
|---|---|
| Is this level clear on a higher time frame? | Higher-time-frame levels often carry more weight |
| Is it a zone, not just a thin line? | Zones better reflect real market behavior |
| Has price reacted here before? | Repeated reactions make the level more meaningful |
| Is the overall trend supportive? | Trading with the trend can reduce risk |
| Is there confirmation? | A candle close, retest, or volume signal can reduce impulsive entries |
| Where is the invalidation point? | You need to know where the idea is wrong |
| Is the risk-to-reward reasonable? | A good level still may not be a good trade |
| Is there major news or a token unlock nearby? | Events can override technical setups |
| Am I using position sizing? | One failed trade should not damage your account badly |
| Did I write down the plan? | Written plans reduce emotional decisions |
21. Support and Resistance vs Supply and Demand Zones
Support and resistance are often drawn as horizontal zones where price reacted before. Supply and demand zones are similar, but they usually focus more on where a strong move began. A demand zone is an area where buyers previously stepped in strongly. A supply zone is an area where sellers previously took control.
| Concept | Focus | Example |
|---|---|---|
| Support | Where price previously stopped falling | A coin bounced from $20 several times |
| Resistance | Where price previously stopped rising | A coin failed near $30 several times |
| Demand zone | Where a strong upward move began | Price based around $18-$20, then rallied fast |
| Supply zone | Where a strong downward move began | Price based around $30-$32, then dropped fast |
Beginners do not need to overcomplicate this. The practical goal is the same: identify areas where buying or selling pressure may appear and plan risk around them.
22. Support and Resistance for Investors vs Traders
| User type | How they may use levels | Main caution |
|---|---|---|
| Long-term investor | Identify major accumulation areas, avoid buying into euphoric resistance, plan staged entries | Do not rely only on charts; fundamentals and risk tolerance matter |
| Swing trader | Plan trades over days or weeks using daily and 4-hour levels | Avoid overtrading every minor move |
| Day trader | Use intraday levels for entries, exits, and stop placement | Lower time frames are noisy and fast |
| Beginner | Use levels to learn market structure and avoid random trades | Practice first; avoid leverage |
23. Real-World Scenario: A Range Market
A coin trades between $0.90 and $1.20 for several weeks. Price repeatedly bounces near $0.90 and rejects near $1.20. This is a range.
A beginner might plan to watch for either:
- A bounce setup near $0.90 support, only after price shows signs of holding.
- A breakout setup if price closes above $1.20 with strong volume and later retests the area.
- A breakdown warning if price closes below $0.90 and fails to recover quickly.
The key is not to assume the range will last forever. Ranges eventually break. A good plan includes what to do if the market does the opposite of what you expected.
24. Real-World Scenario: A Trending Market
In an uptrend, price often makes higher highs and higher lows. Support may form at previous breakout areas, rising trendlines, or key moving averages. In a downtrend, resistance may form at previous breakdown areas, falling trendlines, or moving averages.
A common beginner mistake is shorting every resistance level in a strong uptrend or buying every support level in a strong downtrend. Trend context matters. Support in an uptrend is usually more useful for long setups. Resistance in a downtrend is often more useful for short setups or avoiding new buys.
25. How to Practice Without Risking Money
- Open a charting platform and choose a major crypto asset with high liquidity.
- Remove most indicators and mark only the clearest weekly and daily levels.
- Move forward candle by candle and write down where you would expect reactions.
- Record whether price bounced, broke, retested, or ignored the level.
- Take screenshots before and after the move.
- Build a small journal of examples. Over time, you will see which levels were useful and which were not.
This practice helps you train your eye without the emotional pressure of real money.
26. Pros and Cons of Support and Resistance Analysis
| Pros | Cons |
|---|---|
| Easy for beginners to understand | Can be subjective |
| Works across many time frames | False breakouts are common |
| Helps with planning risk and targets | Does not predict news or sudden events |
| Useful with simple charts | Can lead to overconfidence if used alone |
| Can improve discipline | Too many levels can confuse decisions |
27. Frequently Asked Questions
27.1 What is support in crypto?
Support is a price area where buying interest has previously been strong enough to slow or reverse a decline. It is best treated as a zone, not an exact price.
27.2 What is resistance in crypto?
Resistance is a price area where selling pressure has previously been strong enough to slow or reverse a rise. Price may reject from resistance, break through it, or move sideways near it.
27.3 Are support and resistance reliable?
They can be useful, but they are not guaranteed. Their reliability depends on market context, liquidity, time frame, volume, and whether major news is affecting the asset.
27.4 How many touches make a support or resistance level valid?
There is no fixed rule, but two or more clear reactions make a level more interesting. A very strong single reaction from a major high or low can also matter.
27.5 Should I use candle wicks or candle bodies?
Use both. Candle bodies show where price closed, while wicks show where price was rejected. A practical zone often includes both.
27.6 What time frame is best for beginners?
Daily and weekly charts are usually better for learning because they reduce noise. Shorter time frames can be useful later, but they create more false signals.
27.7 What happens when support breaks?
When support breaks, it may signal weakness. The old support area may later act as resistance if price returns to it and sellers appear.
27.8 What happens when resistance breaks?
When resistance breaks, it may signal strength. The old resistance area may later act as support if price pulls back and buyers defend it.
27.9 Can support and resistance be used for long-term investing?
Yes, but they should not be the only factor. Long-term investors should also consider fundamentals, project risk, tokenomics, security, regulation, and portfolio management.
27.10 Do indicators make support and resistance more accurate?
Indicators can add context, but they do not remove risk. Volume, moving averages, RSI, and Fibonacci levels can be helpful when used carefully and not overloaded.
27.11 Is support and resistance enough for trading crypto?
No. It is one tool. A complete trading plan also includes risk management, position sizing, market context, emotional discipline, and a clear exit plan.
27.12 Why do false breakouts happen so often in crypto?
False breakouts can happen because of leverage, stop orders, low liquidity, market manipulation, sudden news, and traders reacting to the same obvious levels.
28. Conclusion: Use Levels as a Map, Not a Guarantee
Support and resistance in crypto can help beginners understand price behavior, plan trades more clearly, and avoid emotional decisions. Support shows where buyers may appear. Resistance shows where sellers may appear. Breakouts, breakdowns, and retests can provide useful clues about momentum and market structure.
The most important lesson is that these levels are not magic. They are areas of interest where you prepare a plan. Good traders do not simply draw a line and hope. They consider trend, volume, time frame, risk-to-reward, position size, and invalidation. They also accept that any setup can fail.
If you are new to crypto, start slowly. Practice marking levels on major liquid assets, keep your charts clean, use zones instead of exact lines, and focus on protecting your capital. Over time, support and resistance can become a practical part of a disciplined trading process.
Reader Advice
This article is provided for educational and informational purposes only. It explains general technical-analysis concepts and is not financial, investment, trading, legal, tax, or personalized advice or a recommendation to buy, sell, or hold any crypto asset. Crypto markets can be highly volatile, losses may be substantial, and support or resistance levels can fail without warning. Rules, policies, laws, market practices, and statistics may change over time and vary by country, region, platform, and asset, so please verify important information through current official sources and consider advice from a qualified professional before making decisions. Use independent research, sensible risk controls, and only funds you can afford to lose.