Moving Averages in Crypto: Complete Guide, Examples, Risks and Best Practices
Moving averages are among the most widely used tools in crypto chart analysis. They help traders and investors smooth out noisy price movements so they can see the bigger trend more clearly. Instead of reacting to every candle, wick, or sudden price jump, a moving average shows the average price over a chosen number of periods.
For beginners, this can make a crypto chart feel less confusing. Bitcoin, Ethereum, and altcoins often move quickly, and price can change sharply within minutes. A moving average does not predict the future, but it can help you understand whether the market has been trending up, trending down, or moving sideways.
This guide explains what moving averages mean, how they work, the difference between SMA and EMA, how traders use them in crypto, common examples, benefits, limitations, risks, and best practices. It is educational content, not financial advice.
1. Quick Answer: What Is a Moving Average in Crypto?
A moving average in crypto is a line on a price chart that shows the average price of a cryptocurrency over a selected number of candles or time periods. For example, a 20-day moving average shows the average closing price over the last 20 days. As each new day is added, the oldest day drops out, so the average keeps moving.
- A rising moving average usually suggests upward momentum.
- A falling moving average usually suggests downward momentum.
- A flat moving average often suggests a sideways or uncertain market.
- Shorter moving averages react faster but create more false signals.
- Longer moving averages react slower but often show the broader trend more clearly.
2. Simple Visual Example
The chart below is an illustrative example. It shows how a short-term moving average reacts faster to price changes, while a longer-term moving average moves more slowly and smooths out more noise.
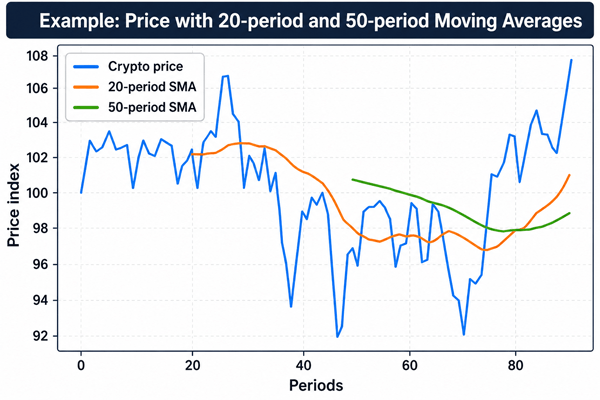
Figure 1: Example price line with 20-period and 50-period simple moving averages. This is an educational illustration, not a real trading signal.
3. What Is a Moving Average?
A moving average is a technical indicator that calculates the average price of an asset over a set number of periods. In crypto, each period can be one minute, five minutes, one hour, one day, one week, or any other chart timeframe. The moving average updates as new price data appears.
4. Why Crypto Traders Use Moving Averages
Crypto markets are open 24 hours a day and can be highly volatile. Moving averages help reduce chart noise, identify trend direction, highlight possible support or resistance areas, and create simple rules for entries, exits, and risk management.
5. What Price Does a Moving Average Use?
Most moving averages are calculated from closing prices, because the close is often considered the final agreed price for that candle. However, many charting platforms also allow moving averages based on open, high, low, or average price. Beginners should usually start with the closing price setting.
6. How Moving Averages Work
The basic idea is simple: add a group of recent prices together, then divide by the number of prices in the group. When a new price appears, the oldest price is removed and the latest price is added.
Example: A 5-day simple moving average uses the last five daily closing prices.
| Day | Closing Price |
|---|---|
| Day 1 | $100 |
| Day 2 | $105 |
| Day 3 | $102 |
| Day 4 | $108 |
| Day 5 | $110 |
5-day SMA = (100 + 105 + 102 + 108 + 110) / 5 = 105
So the 5-day simple moving average is $105. If the next day closes at $115, Day 1 drops out and Day 6 is added. The average then becomes:
(105 + 102 + 108 + 110 + 115) / 5 = 108
This is why it is called a moving average: the calculation keeps moving forward as new candles are added.
7. Main Types of Moving Averages Used in Crypto
There are many types of moving averages, but beginners usually need to understand two first: the simple moving average and the exponential moving average.
| Type | Meaning | How it behaves | Best used for |
|---|---|---|---|
| SMA | Simple Moving Average | Gives equal weight to every price in the selected period. | Clear trend view, long-term analysis, support and resistance. |
| EMA | Exponential Moving Average | Gives more weight to recent prices. | Faster signals, short-term trading, momentum tracking. |
| WMA | Weighted Moving Average | Weights recent data more heavily in a linear way. | Advanced traders who want more responsiveness than SMA. |
| VWMA | Volume Weighted Moving Average | Uses both price and volume. | Checking whether price moves are supported by trading volume. |
7.1 Simple Moving Average (SMA)
A simple moving average gives equal importance to every price in the selected period. A 50-day SMA treats the price from 50 days ago the same as yesterday’s price. This makes it smoother and slower than an EMA.
SMA is useful when you want to identify the broader market direction rather than react to every short-term move.
7.2 Exponential Moving Average (EMA)
An exponential moving average gives more importance to recent prices. Because of this, it reacts faster when the market changes direction. Many short-term crypto traders prefer EMAs because crypto can move quickly.
The downside is that faster reaction can also mean more false signals, especially when the market is choppy or moving sideways.
8. SMA vs EMA: Which Is Better for Crypto?
Neither SMA nor EMA is automatically better. The right choice depends on your trading style, timeframe, and risk tolerance.
| Question | SMA | EMA |
|---|---|---|
| Which reacts faster? | Slower | Faster |
| Which is smoother? | Usually smoother | Less smooth |
| Which may create more false signals? | Usually fewer | Usually more |
| Better for beginners? | Often easier to understand | Useful after understanding basics |
| Common use | Trend direction and long-term levels | Short-term momentum and entries |
A beginner can start with SMA to understand trend structure, then compare it with EMA on the same chart. Seeing both lines together often makes the difference clear: the EMA hugs price more closely, while the SMA moves more calmly.
9. Common Moving Average Periods in Crypto
The period you choose changes what the moving average tells you. A 9-period moving average on a 15-minute chart is very different from a 200-day moving average on a daily chart.
| Moving Average | Common Meaning | Typical Use |
|---|---|---|
| 9 EMA or 10 EMA | Very short-term momentum | Scalping and fast intraday trading |
| 20 SMA or 20 EMA | Short-term trend | Swing trading and pullback analysis |
| 50 SMA or 50 EMA | Medium-term trend | Trend confirmation and dynamic support/resistance |
| 100 SMA | Intermediate trend | Extra trend filter for larger moves |
| 200 SMA | Long-term trend | Bull/bear market context and major support/resistance |
A common beginner mistake is using too many moving averages at once. This can make the chart messy and confusing. Start with one or two moving averages, such as the 20-day and 50-day, or the 50-day and 200-day.
10. How Traders Use Moving Averages in Crypto
10.1 Identifying the Trend Direction
The simplest use is trend direction. If price is above a rising moving average, the market may be in an uptrend. If price is below a falling moving average, the market may be in a downtrend. If price keeps crossing above and below a flat moving average, the market may be sideways.
- Uptrend: price often stays above key moving averages.
- Downtrend: price often stays below key moving averages.
- Sideways market: price crosses the moving average repeatedly with no clear direction.
10.2 Dynamic Support and Resistance
A moving average can act like a flexible support or resistance area. In an uptrend, price may pull back toward a moving average and then bounce. In a downtrend, price may rally into a moving average and then fall again.
These are not guaranteed levels. They are zones where traders watch for confirmation, such as strong candles, volume changes, or a reaction near a previous support or resistance area.
10.3 Moving Average Crossovers
A crossover happens when one moving average crosses another. Traders often compare a shorter moving average with a longer one.
| Crossover | What it means | Important caution |
|---|---|---|
| Bullish crossover | A shorter moving average crosses above a longer moving average. | Can be late if price already moved strongly. |
| Bearish crossover | A shorter moving average crosses below a longer moving average. | Can create false signals in sideways markets. |
| Golden cross | The 50-day moving average crosses above the 200-day moving average. | Often watched as a long-term bullish signal, but not a guarantee. |
| Death cross | The 50-day moving average crosses below the 200-day moving average. | Often watched as a long-term bearish signal, but it can lag after a large drop. |
10.4 Pullback Entries
Some traders use moving averages to avoid buying after a sharp vertical move. Instead, they wait for price to pull back toward a moving average during an uptrend. This can help them look for better risk-to-reward opportunities.
For example, if Ethereum is trending above its 20-day EMA and 50-day SMA, a trader may wait for a pullback toward the 20-day EMA instead of buying after several green candles in a row.
10.5 Exit or Risk Management Signals
Moving averages can also help with exits. A trader may decide to stay in a position while price remains above a chosen moving average and reduce exposure if price closes below it. This turns a vague feeling into a clearer rule.
However, using a moving average as a stop-loss can be risky in crypto because sudden wicks can briefly break a level and then reverse. Many traders combine moving averages with structure-based stops, position sizing, and broader market context.
11. Practical Examples of Moving Averages in Crypto
11.1 Example 1: Beginner Trend Filter
Imagine Bitcoin is trading above its 200-day SMA, and the 200-day SMA is slowly rising. A beginner may treat this as a sign that the long-term trend is healthier than when price is below a falling 200-day SMA.
- Possible interpretation: long-term trend is positive.
- Possible action: look only for long setups, or avoid shorting aggressively.
- Risk: the signal can be late and may fail during sharp reversals.
11.2 Example 2: 20 EMA Pullback in an Uptrend
Suppose Solana is in a strong uptrend. Price repeatedly pulls back toward the 20 EMA and then continues higher. A trader may watch the next pullback to the 20 EMA for a possible entry, but only if other evidence supports it, such as higher lows, strong volume, and no major bearish news.
- Possible entry idea: wait for a bounce near the 20 EMA.
- Possible invalidation: price closes clearly below the 20 EMA and previous swing low.
- Risk: in a fast sell-off, the moving average may not hold.
11.3 Example 3: False Signal in a Sideways Market
A crypto asset trades sideways between $0.90 and $1.10 for several weeks. The 20 EMA and 50 SMA cross several times, but price keeps returning to the middle of the range. In this situation, moving average crossovers may produce losing trades because there is no strong trend.
This is why moving averages often work better in trending markets than in sideways, choppy markets.
12. Benefits of Moving Averages in Crypto
- They simplify noisy charts and make trends easier to see.
- They are beginner-friendly and available on almost every charting platform.
- They can help create rules instead of emotional decisions.
- They work across many timeframes, from intraday charts to weekly charts.
- They can be combined with support and resistance, volume, RSI, MACD, and candlestick patterns.
- They help traders avoid guessing by giving a clear reference line.
13. Risks and Limitations of Moving Averages
- They are lagging indicators, which means they are based on past prices.
- They do not predict news events, exchange failures, hacks, regulation changes, or sudden liquidations.
- They can give many false signals in sideways markets.
- They can make traders overconfident if used alone.
- They may react too slowly during fast crypto crashes.
- Different settings can produce different signals, which can confuse beginners.
- They do not replace risk management, stop-loss planning, or position sizing.
The biggest mistake is treating a moving average like a magic line. It is not a guarantee of support, resistance, profit, or reversal. It is only a tool for organizing price information.
14. Best Practices for Using Moving Averages in Crypto
- Start with simple settings. Use one or two moving averages before adding more indicators.
- Match the moving average to your timeframe. A day trader and a long-term investor should not rely on the same chart settings in the same way.
- Use moving averages as zones, not exact numbers. Crypto prices often overshoot levels before reversing.
- Confirm signals with market structure. Higher highs, higher lows, support, resistance, and volume matter.
- Avoid trading every crossover. Crossovers are weaker in sideways markets.
- Backtest or review examples before risking money. Look at how the moving average behaved in past trending and ranging conditions.
- Decide your risk before entering. Know where the trade idea is invalidated.
- Use position sizing. Even a good setup can fail.
- Do not change settings after every losing trade. Constantly changing indicators can lead to confusion and curve fitting.
- Remember that moving averages are educational tools, not financial guarantees.
15. Choosing the Right Moving Average for Your Trading Style
| Trading style | Common chart timeframe | Possible moving averages | Main focus |
|---|---|---|---|
| Scalping | 1-minute to 15-minute | 9 EMA, 20 EMA | Fast momentum and quick exits |
| Day trading | 15-minute to 4-hour | 20 EMA, 50 EMA | Intraday trend and pullbacks |
| Swing trading | 4-hour to daily | 20 SMA/EMA, 50 SMA/EMA | Multi-day trend and support/resistance |
| Position trading | Daily to weekly | 50 SMA, 100 SMA, 200 SMA | Longer-term market direction |
| Long-term investing | Weekly and monthly | 50-week SMA, 200-day SMA | Broad bull/bear market context |
16. A Simple Beginner Moving Average Strategy Template
This is not a recommendation to buy or sell. It is a learning template that shows how a beginner might structure a rules-based approach.
| Step | Rule |
|---|---|
| Trend filter | Only consider long trades when price is above a rising 50-period moving average. |
| Entry area | Wait for price to pull back near the 20-period moving average. |
| Confirmation | Look for a bullish candle, bounce from support, or improving volume. |
| Invalidation | Exit if price closes below the recent swing low or if the trend structure breaks. |
| Risk control | Risk only a small percentage of account equity on one trade. |
| Review | Record the trade reason, entry, exit, result, and lesson learned. |
The purpose of a template is to reduce random decisions. A trader should test and adapt any approach before using real money.
17. Moving Averages with Other Indicators
Moving averages become more useful when combined with other forms of analysis. The goal is not to add more indicators for decoration, but to answer different questions.
| Tool | Question it helps answer | How it can support moving averages |
|---|---|---|
| Support and resistance | Where has price reacted before? | A moving average bounce is stronger if it aligns with a known level. |
| Volume | Is the move supported by participation? | A breakout above a moving average with rising volume may be more meaningful. |
| RSI | Is momentum stretched or weakening? | A trend above a moving average with RSI holding above midline can support bullish momentum. |
| MACD | Is momentum shifting? | MACD can help confirm trend changes suggested by moving average behavior. |
| Candlestick patterns | How is price reacting right now? | Reversal or continuation candles near a moving average can provide context. |
18. Common Mistakes and Misconceptions
18.1 Mistake 1: Thinking Moving Averages Predict the Future
Moving averages summarize past prices. They can help you understand current trend behavior, but they cannot know what will happen next.
18.2 Mistake 2: Using Too Many Lines
A chart with seven moving averages may look advanced, but it can make decisions harder. More indicators do not always mean better analysis.
18.3 Mistake 3: Ignoring the Market Type
Moving averages tend to be more helpful in trending markets. In sideways markets, price may cross the moving average again and again, creating false entries.
18.4 Mistake 4: Copying Settings Without Understanding Them
A 20 EMA on a 5-minute chart does not mean the same thing as a 20 EMA on a daily chart. Always connect settings to your actual trading timeframe.
18.5 Mistake 5: No Risk Plan
Even a textbook moving average setup can fail. Without position sizing and an exit plan, one bad trade can damage an account.
19. Moving Average Checklist for Beginners
- Is the moving average rising, falling, or flat?
- Is price above, below, or repeatedly crossing it?
- Is the market trending or ranging?
- Does the signal align with support, resistance, volume, or market structure?
- What would prove the trade idea wrong?
- How much are you risking if the setup fails?
- Are you trading because of a plan, or because of fear of missing out?
20. Pros and Cons of Moving Averages in Crypto
| Pros | Cons |
|---|---|
| Easy to understand and widely available. | Lag behind current price because they use past data. |
| Helpful for identifying trend direction. | Can give false signals in choppy markets. |
| Useful across different timeframes. | Settings can be confusing for beginners. |
| Can support rule-based trading plans. | Do not account for news, liquidity shocks, or major events. |
| Combine well with other tools. | Can encourage overconfidence when used alone. |
21. FAQs About Moving Averages in Crypto
21.1 What is the best moving average for crypto?
There is no single best moving average for all crypto traders. Short-term traders often use faster EMAs such as the 9 EMA or 20 EMA. Swing traders may use the 20, 50, or 100 moving average. Long-term investors often watch the 200-day moving average. The best choice depends on your timeframe and strategy.
21.2 Is EMA better than SMA for crypto?
EMA reacts faster to recent price changes, which can be useful in fast-moving crypto markets. SMA is smoother and may be better for seeing the broader trend. EMA is not always better because faster signals can also mean more false signals.
21.3 What does it mean when price is above a moving average?
It often suggests that price is stronger than its recent average. If the moving average is also rising, it may support an uptrend view. But price above a moving average does not guarantee that price will keep rising.
21.4 What is a golden cross in crypto?
A golden cross usually happens when the 50-day moving average crosses above the 200-day moving average. Many traders view it as a long-term bullish signal, but it can be late and should not be used alone.
21.5 What is a death cross in crypto?
A death cross usually happens when the 50-day moving average crosses below the 200-day moving average. Many traders view it as a long-term bearish signal, but it can occur after much of the price decline has already happened.
21.6 Do moving averages work for altcoins?
They can be used on altcoin charts, but altcoins may be more volatile, less liquid, and more vulnerable to sharp moves than major cryptocurrencies. Signals can fail more often on thinly traded assets.
21.7 Can moving averages be used for long-term investing?
Yes. Long-term investors may use moving averages such as the 200-day SMA or 50-week SMA to understand broad trend conditions. However, investment decisions should also consider fundamentals, risk tolerance, time horizon, and portfolio management.
21.8 Should beginners trade moving average crossovers?
Beginners can study crossovers, but they should be careful. Crossovers are easy to understand but can create false signals in sideways markets. It is better to combine them with trend structure, support and resistance, and risk rules.
Final Thoughts
Moving averages are useful because they make crypto charts easier to read. They help beginners identify trend direction, understand momentum, watch possible support or resistance areas, and build clearer trading rules. But they are not predictive tools, and they should never be treated as guaranteed buy or sell signals.
The best way to learn moving averages is to apply them to historical charts, compare different periods, observe how they behave in trends and ranges, and practice building a risk-managed plan. In crypto, where volatility can be extreme, the most important skill is not finding a perfect indicator. It is using simple tools with discipline, context, and strong risk management.
Reader Advice
This article is provided for educational and informational purposes only. It is not personalized financial, investment, trading, legal, or tax advice, and it does not recommend buying, selling, or holding any cryptocurrency. Crypto markets can be highly volatile, and losses may be substantial, including the possible loss of all money committed. Moving-average signals can lag, fail, or produce false results, so readers should conduct their own research, use appropriate risk controls, and consider guidance from suitably qualified professionals. Rules, policies, laws, market practices, platform terms, and statistics may change over time and vary by country or region; verify important information through current official and authoritative sources before making a decision.