MACD Indicator Explained: Meaning, How It Works, Examples, Benefits and Risks
The MACD indicator is one of the most widely used tools in technical analysis. Traders use it to study price momentum, trend direction and possible changes in market strength. MACD stands for Moving Average Convergence Divergence. The name sounds technical, but the basic idea is simple: MACD compares two moving averages to show whether price momentum is getting stronger or weaker.
For beginners, MACD can be useful because it turns price movement into a visual indicator made of a MACD line, a signal line and a histogram. These parts can help traders spot possible buy or sell signals, confirm a trend, or avoid entering when momentum is weak. However, MACD is not a prediction machine. It can give late signals, false signals and confusing signals in sideways markets. This guide explains the MACD indicator in plain English, with examples, practical uses, benefits, risks and best practices.
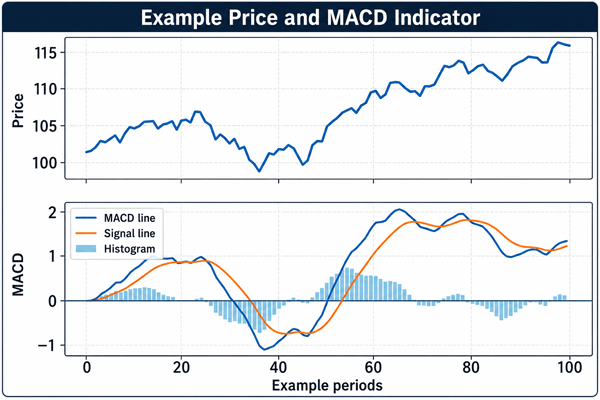
Figure 1: Example of a price chart with MACD line, signal line and histogram.
1. What Is the MACD Indicator?
MACD is a trend-following momentum indicator. It was designed to help traders see changes in momentum by comparing a faster moving average with a slower moving average. When the faster average moves away from the slower average, momentum is changing. When it moves closer, momentum is slowing.
The standard MACD setting is 12, 26, 9. This means the indicator usually uses a 12-period exponential moving average, a 26-period exponential moving average and a 9-period signal line. The word period can mean days on a daily chart, hours on an hourly chart, or candles on any other timeframe.
2. Why Traders Use MACD
Traders use MACD because it helps answer practical questions: Is the market gaining upward momentum? Is selling pressure increasing? Is a trend weakening? Could a trend reversal be starting? MACD does not answer these questions perfectly, but it gives a structured way to study them.
MACD is used in stocks, forex, crypto, commodities and indices. The same basic logic applies across markets, but results can vary depending on volatility, timeframe, liquidity and market conditions.
3. The Main Parts of MACD
| MACD part | What it means | How beginners can read it |
|---|---|---|
| MACD line | The difference between the 12-period EMA and 26-period EMA. | A rising MACD line often means bullish momentum is improving; a falling line often means bearish momentum is increasing. |
| Signal line | A 9-period EMA of the MACD line. | Used as a smoother reference line. Crossovers between MACD and signal line are common trading signals. |
| Histogram | The distance between the MACD line and signal line. | Bars above zero show MACD above the signal line; bars below zero show MACD below the signal line. Growing bars show stronger momentum. |
| Zero line | The point where the fast EMA and slow EMA are equal. | MACD above zero suggests the short-term average is above the long-term average; below zero suggests the opposite. |
4. How the MACD Indicator Works
MACD works by comparing two exponential moving averages. An exponential moving average gives more weight to recent prices than older prices. This makes it more responsive than a simple moving average.
The standard formula is: MACD line = 12-period EMA - 26-period EMA. Signal line = 9-period EMA of the MACD line. Histogram = MACD line - signal line.
When the 12-period EMA rises faster than the 26-period EMA, the MACD line rises. This usually means upward momentum is increasing. When the 12-period EMA falls faster than the 26-period EMA, the MACD line falls. This usually means downward momentum is increasing.
5. What Does MACD Tell You?
MACD mainly tells you about momentum, trend strength and possible shifts in direction. It does not tell you the fair value of an asset, whether a company is strong, or whether a coin or stock is safe to buy.
A positive MACD value means the shorter EMA is above the longer EMA. A negative MACD value means the shorter EMA is below the longer EMA. The distance from the zero line can show how strong the difference is, but very large readings can also suggest the move is stretched.
6. How to Read MACD Signals
6.1 MACD Line and Signal Line Crossover
A bullish crossover happens when the MACD line crosses above the signal line. Some traders see this as a possible buy or long signal, especially if price is also in an uptrend.
A bearish crossover happens when the MACD line crosses below the signal line. Some traders see this as a possible sell, exit or short signal, especially if price is also in a downtrend.
Crossovers are popular, but they can be noisy. In sideways markets, MACD may cross back and forth many times without a meaningful trend.
6.2 Zero Line Crossover
A zero line crossover happens when the MACD line crosses above or below the zero line. Crossing above zero means the fast EMA has moved above the slow EMA, which can confirm bullish momentum. Crossing below zero means the fast EMA has moved below the slow EMA, which can confirm bearish momentum.
Zero line crossovers are often slower than signal line crossovers, but they can be more useful for confirming broader trend direction.
6.3 MACD Histogram Changes
The histogram shows the gap between the MACD line and the signal line. When histogram bars grow above zero, bullish momentum may be strengthening. When bars shrink, bullish momentum may be weakening. When bars grow below zero, bearish momentum may be strengthening.
Beginners often find the histogram helpful because it visually shows whether momentum is expanding or contracting.
6.4 MACD Divergence
Divergence happens when price and MACD move in different directions. Bullish divergence may occur when price makes a lower low, but MACD makes a higher low. This can suggest that selling momentum is weakening.
Bearish divergence may occur when price makes a higher high, but MACD makes a lower high. This can suggest that buying momentum is weakening.
Divergence can be useful, but it is not an automatic reversal signal. Price can keep moving in the same direction for a long time even after divergence appears.
| Signal | Possible meaning | Beginner caution |
|---|---|---|
| MACD crosses above signal line | Bullish momentum may be improving. | Works better when price is already making higher highs and higher lows. |
| MACD crosses below signal line | Bearish momentum may be increasing. | Can be a false signal in a sideways market. |
| MACD crosses above zero | Trend may be turning more bullish. | Often arrives after part of the move has already happened. |
| MACD crosses below zero | Trend may be turning more bearish. | Do not use alone without price structure or risk management. |
| Bullish divergence | Selling pressure may be weakening. | Needs confirmation; divergence can last for many candles. |
| Bearish divergence | Buying pressure may be weakening. | Not a guaranteed sell signal. |
7. Practical Example: Using MACD in an Uptrend
Imagine a stock is making higher highs and higher lows on the daily chart. The price pulls back toward a support area, but it does not break the trend. After a few days, the MACD line crosses above the signal line while the histogram turns from negative to positive. A trader may see this as confirmation that bullish momentum is returning.
A beginner should not enter only because of the MACD crossover. A more complete approach would be to check whether price is above an important moving average, whether volume supports the move, where the nearest resistance is, and where the stop-loss would go if the trade is wrong.
8. Practical Example: Using MACD in a Downtrend
Now imagine a crypto asset is below a major resistance level and price is making lower highs. MACD crosses below the signal line and the histogram turns negative. This may suggest bearish momentum is increasing. A trader may avoid buying too early, close a weak long position, or look for a short setup if that fits their strategy and risk rules.
Again, MACD is only one piece of evidence. A trader should consider the broader market, volatility, liquidity, news risk and the distance to support.
9. Practical Example: MACD False Signal in a Sideways Market
Suppose price has been moving in a narrow range for several weeks. MACD crosses above and below the signal line several times, but price does not break out. A beginner may keep taking small losing trades because each crossover looks like a new signal.
This is one of MACD’s biggest weaknesses. MACD generally performs better when there is a clear trend or when a new trend is developing. In flat markets, support and resistance, volume and range analysis may be more useful than repeated MACD crossovers.
10. MACD Settings: What Do 12, 26 and 9 Mean?
The common MACD setting is written as 12, 26, 9. The first number is the fast EMA, the second is the slow EMA and the third is the signal line period. On a daily chart, these are often interpreted as 12 days, 26 days and 9 days. On an hourly chart, they refer to 12 hours, 26 hours and 9 hours if each candle is one hour.
Shorter settings make MACD more sensitive and produce more signals. Longer settings make MACD smoother and produce fewer signals. More signals are not always better. A very sensitive MACD can create many false alerts, while a very slow MACD can react too late.
| Setting type | Example | What happens | Best for |
|---|---|---|---|
| Standard | 12, 26, 9 | Balanced and widely used. | General chart analysis and learning. |
| Faster | 8, 17, 9 | More responsive but more false signals. | Short-term traders who can manage noise. |
| Slower | 19, 39, 9 | Smoother but later signals. | Longer-term trend confirmation. |
11. Benefits of the MACD Indicator
MACD is popular because it is visual, flexible and easy to apply to many markets. It can help beginners understand momentum without needing complex formulas.
Key benefits include trend confirmation, momentum analysis, clearer visual signals, usefulness across multiple timeframes, and the ability to combine it with support and resistance, moving averages, volume or RSI.
12. Risks and Limitations of MACD
MACD has real limitations. It is based on moving averages, so it usually reacts after price has already moved. This means signals can be late. It can also produce false signals in sideways or low-volatility markets.
MACD does not measure market fundamentals, news, liquidity, fees, slippage or emotional risk. In crypto and other volatile markets, a MACD signal can change quickly after a large candle. Traders should never rely on MACD alone.
13. Common MACD Mistakes Beginners Make
Many beginners treat every crossover as a trade signal. This is risky. A crossover against the main trend is often weaker than a crossover in the direction of the trend.
Another mistake is ignoring the timeframe. A bullish MACD signal on a five-minute chart may mean very little if the daily chart is in a strong downtrend. Beginners also often enter too late after a large move, ignore support and resistance, or trade without a stop-loss plan.
| Mistake | Why it is risky | Better practice |
|---|---|---|
| Trading every crossover | Creates many low-quality trades. | Use trend, support/resistance and volume as confirmation. |
| Ignoring market structure | MACD can be bullish while price is under strong resistance. | Check higher highs, lower lows, support and resistance. |
| Using one timeframe only | Small timeframe signals can conflict with the larger trend. | Start with a higher timeframe, then refine entries on a lower timeframe. |
| No risk management | A good signal can still fail. | Plan position size, stop-loss and exit before entering. |
| Expecting exact tops and bottoms | MACD is usually not early enough for perfect entries. | Use it as confirmation, not as a crystal ball. |
14. MACD vs RSI: What Is the Difference?
MACD and RSI are both momentum indicators, but they work differently. MACD compares moving averages to show momentum and trend changes. RSI measures the speed and size of recent price moves and is often used to identify overbought or oversold conditions.
Many traders use MACD and RSI together. For example, MACD may confirm that bullish momentum is improving while RSI helps check whether price is already overextended.
| Feature | MACD | RSI |
|---|---|---|
| Main purpose | Trend and momentum shifts. | Momentum strength and overbought/oversold conditions. |
| Typical scale | No fixed upper or lower limit. | Usually 0 to 100. |
| Common signals | Crossovers, zero line, histogram, divergence. | 70/30 zones, midline, divergence, trend ranges. |
| Best use | Confirming momentum with trend direction. | Checking strength, exhaustion and pullbacks. |
15. Best Practices for Using MACD
Use MACD as part of a complete trading process. Start with the market context: Is the asset trending, ranging, breaking out or reversing? Then use MACD to confirm whether momentum supports the idea.
For beginners, a practical checklist is: identify the trend, mark support and resistance, check MACD direction, look for a clean signal, define risk, plan the exit and only then consider a trade. If the signal is unclear, skipping the trade is often the best decision.
16. A Simple MACD Trading Checklist
Before using a MACD signal, ask: Is price trending or ranging? Is the signal in the same direction as the main trend? Is price near support or resistance? Is the histogram confirming momentum? Is there enough room before the next support or resistance level? What is the risk if the trade fails?
17. Who Should Use MACD?
MACD can be useful for beginners who want a structured way to study momentum, but it should be learned slowly. It is more helpful for traders who are willing to combine indicators with price action and risk management. It is less suitable for people who want guaranteed signals or quick profits without practice.
18. Is MACD Good for Crypto Trading?
MACD can be used on crypto charts, but crypto markets are often highly volatile and can move sharply at any time. This can create fast reversals, false signals and emotional pressure. Crypto traders should be especially careful with leverage, fees, slippage and news-driven moves. MACD may help with momentum analysis, but it cannot remove crypto market risk.
19. Final Thoughts
The MACD indicator is a practical tool for understanding momentum and trend direction. Its main strength is that it simplifies moving-average relationships into clear visual signals. Its main weakness is that it can be late or wrong, especially when price is moving sideways.
For beginners, the best way to use MACD is not to search for perfect signals. Instead, use it as a confirmation tool. Combine it with price action, support and resistance, higher-timeframe analysis and strict risk management. When used carefully, MACD can become a helpful part of a trading plan. When used alone, it can easily lead to mistakes.
20. FAQs About the MACD Indicator
20.1 What does MACD stand for?
MACD stands for Moving Average Convergence Divergence. It compares two exponential moving averages to show changes in momentum.
20.2 What is the best MACD setting?
The most common setting is 12, 26, 9. It is not always the best for every market or timeframe, but it is a good starting point for beginners.
20.3 Is MACD a leading or lagging indicator?
MACD is mostly a lagging indicator because it is based on moving averages. It can still help identify momentum changes, but signals often appear after price has already started moving.
20.4 What is a bullish MACD signal?
A common bullish signal is when the MACD line crosses above the signal line, especially when price is also in an uptrend or breaking above resistance.
20.5 What is a bearish MACD signal?
A common bearish signal is when the MACD line crosses below the signal line, especially when price is in a downtrend or failing at resistance.
20.6 Can MACD be used for day trading?
Yes, but shorter timeframes produce more noise and false signals. Day traders should combine MACD with price action, volume, support and resistance, and strict risk controls.
20.7 Does MACD work in sideways markets?
MACD often performs poorly in sideways markets because frequent crossovers can create false signals. It is generally more useful when a market is trending or starting to trend.
20.8 Should beginners use MACD alone?
No. Beginners should use MACD as one part of a broader process that includes trend analysis, support and resistance, position sizing and an exit plan.
Reader Advice
This article is provided for educational and informational purposes only. It is not personalized financial, investment, legal, tax or trading advice, and no MACD signal or example should be treated as a recommendation or a guarantee of results. Trading and investing involve risk, including market volatility, false or delayed signals, fees, slippage, leverage risk and the possible loss of some or all capital. Rules, policies, laws, platform requirements, market practices and statistics can change over time and may vary by country or region, so readers should verify current information through relevant official or regulated sources. Consider your objectives, experience and risk tolerance, conduct independent research, use appropriate risk controls, and seek guidance from a qualified professional where necessary.