S&P 500 Average Return: Historical Performance and Future Expectations
The S&P 500 is one of the most used benchmarks for the U.S. stock market. In simple words, it tracks large publicly traded U.S. companies and gives more weight to bigger companies. Many investors use it as a practical shortcut for long-term stock market exposure through S&P 500 ETFs, index mutual funds, 401(k) plans, IRAs, Roth IRAs, and brokerage accounts.
From 1928 through 2025, the S&P 500 total return series used in this article compounded at about 10.0% per year before inflation. Since the modern 500-company index era began in 1957, the compounded annual return was about 10.6% before inflation. After inflation, the long-run real return was closer to 5.6% to 5.7% per year. These are historical averages, not promises.
Key takeaway The S&P 500 has rewarded patient investors over long periods, but it has never moved in a straight line. The biggest beginner mistake is expecting the average return every year. A 10% long-term average can still include years of +30%, -20%, or worse.
1. What Is the S&P 500?
The S&P 500 is a stock market index. An index is like a scoreboard. It does not sell a product, hold your money, or guarantee a return. It simply measures the performance of a group of stocks using a fixed rulebook.
The S&P 500 is often described as a large-cap U.S. stock index because it includes leading companies from major sectors of the U.S. economy. It is market-cap weighted, meaning larger companies have more influence than smaller companies. If a large technology company rises sharply, it can move the index more than a smaller utility company, even if both are included.
Beginners should understand one important detail: you cannot buy the index itself. You usually invest through an S&P 500 ETF or an S&P 500 index mutual fund. Examples include funds that aim to track the index with low expense ratios. The exact fund choice depends on the brokerage, retirement plan, fees, taxes, and account type available to you.
| Term | Simple meaning | Why it matters |
|---|---|---|
| Index | A measurement tool, like a scoreboard | You cannot invest directly in it. You buy a fund that tracks it. |
| S&P 500 ETF | A fund that trades like a stock and tracks the index | Popular in taxable brokerage accounts and online broker platforms. |
| S&P 500 index fund | A mutual fund that tracks the index | Common in retirement accounts, 401(k)s, IRAs, and automatic investing plans. |
| Total return | Price change plus reinvested dividends | This is the better measure of long-term investor experience. |
| Real return | Return after inflation | Shows how much purchasing power actually improved. |
| Expense ratio | Annual fund fee | Lower fees leave more of the market return for the investor. |
2. What Does “Average Return” Really Mean?
When someone says “the S&P 500 averages about 10% per year,” they usually mean a long-term annualized total return before inflation. But there are different kinds of averages, and confusing them can lead to unrealistic expectations.
2.1 Arithmetic average vs. annualized return
The arithmetic average is a simple average of yearly returns. The annualized return, also called CAGR or geometric return, shows the steady yearly rate that would turn the starting value into the ending value. For investors, annualized return is usually more useful because it reflects compounding.
Example: if an investment loses 50% in year one and gains 50% in year two, the simple average is 0%. But $100 becomes $50, then $75. The investor is still down 25%. That is why “average” can be misleading if you do not know which average is being used.
| Period | Arithmetic average return | Annualized total return | Inflation-adjusted annualized return |
|---|---|---|---|
| 1928-2025 | 11.9% | 10.0% | 5.6% |
| 1957-2025 | 11.9% | 10.6% | 5.7% |
| 1996-2025 | 11.8% | 10.3% | Varies by inflation experience |
| 2000-2025 | 9.6% | 8.0% | Lower after inflation |
| 2016-2025 | 15.7% | 14.7% | Strong but not normal for every decade |
3. S&P 500 Historical Performance: What the Data Shows
Using the annual total return data set maintained by Aswath Damodaran at NYU Stern, the S&P 500 series includes dividends and covers 1928-2025. Over those 98 calendar years, there were 72 positive years and 26 negative years. The best calendar year in this data was 1954, when the total return was about 52.6%. The worst was 1931, with a decline of about -43.8%.
That wide range is the heart of stock investing. The long-term reward has historically come with uncomfortable short-term declines. Investors who only look at the average miss the emotional reality: real people have to live through recessions, inflation scares, bear markets, job uncertainty, and frightening headlines.
Figure 1: S&P 500 annual total returns, 1928-2025
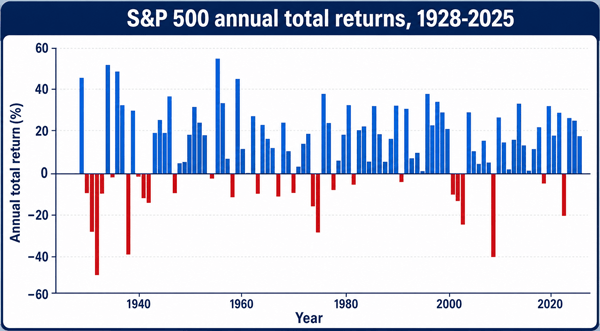
Figure note: Total return means price changes plus dividends. Taxes, fund fees, and investor behavior are not included.
3.1 Important historical lessons
- Long periods matter more than single years. One bad year has often looked less important when viewed over 20 or 30 years.
- Dividends matter. Price-only charts understate the experience of a long-term investor who reinvested dividends.
- Inflation matters. A 10% nominal return does not mean your purchasing power grew by 10%.
- Starting valuation matters, but not perfectly. High valuations can reduce future expected returns, yet they are poor short-term timing tools.
- Behavior matters. The average fund return and the average investor return can differ because people often buy after strong performance and sell after losses.
4. How the S&P 500 Works
4.1 Market-cap weighting
The index gives bigger companies bigger weights. Market capitalization is calculated as share price multiplied by shares outstanding. If Company A is worth $3 trillion and Company B is worth $30 billion, Company A has far more impact on the index.
This is efficient and simple, but it also creates concentration risk. In some periods, a small group of mega-cap companies can drive a large part of the return. Beginners should not assume “500 companies” automatically means equal exposure to 500 companies.
4.2 Rebalancing and company changes
The index is not frozen. Companies can be added or removed based on eligibility rules. An index fund must adjust its holdings to keep tracking the index. Good index funds do this quietly, but the fund may still have tiny tracking differences because of fees, trading costs, cash holdings, and timing.
4.3 Dividends and total return
Some companies pay dividends. If you spend the dividends, your return will be lower than a total-return chart. If you reinvest them, you buy more shares, and compounding can become much more powerful over decades.
5. Why Beginners Like S&P 500 Index Funds
S&P 500 index funds became popular because they are simple, diversified, transparent, and usually low cost. For many beginners, they are easier to understand than trying to choose individual stocks.
| Benefit | What it means in real life | Beginner caution |
|---|---|---|
| Diversification | One fund gives exposure to many large U.S. companies. | It is still mostly U.S. large-cap stock exposure, not a complete global portfolio. |
| Low cost | Many index funds have very low expense ratios. | Small fee differences matter over decades, but do not ignore taxes and account fit. |
| Easy access | Available through many brokerages, IRAs, Roth IRAs, 401(k)s, and robo-advisors. | Check whether your retirement plan has a comparable low-cost option. |
| Tax efficiency | ETFs can be relatively tax-efficient in taxable accounts. | Tax rules vary; tax-loss harvesting and asset location may require a professional. |
| Long track record | Investors can study decades of market behavior. | Past performance does not guarantee future results. |
6. Practical Example: What Could $10,000 Become?
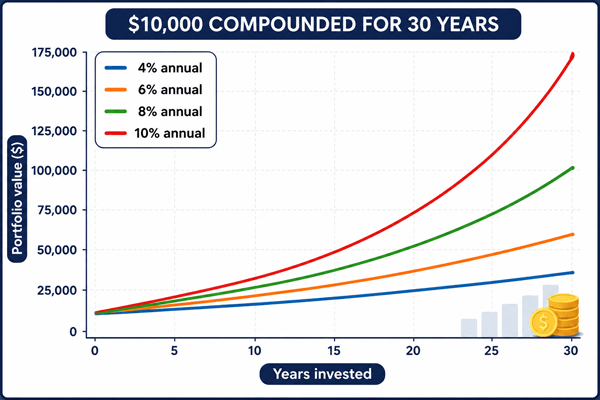
The table below is not a prediction. It simply shows how compounding works at different annual returns. This is useful because future returns may be lower or higher than historical averages.
| Annual return assumption | $10,000 after 10 years | $10,000 after 20 years | $10,000 after 30 years |
|---|---|---|---|
| 4% | $14,802 | $21,911 | $32,434 |
| 6% | $17,908 | $32,071 | $57,435 |
| 8% | $21,589 | $46,610 | $100,627 |
| 10% | $25,937 | $67,275 | $174,494 |
| 12% | $31,058 | $96,463 | $299,599 |
Figure 2: Compound growth is slow at first, then powerful
7. Dollar-Cost Averaging: A Simple Way to Start
Dollar-cost averaging means investing a fixed amount on a regular schedule, such as every payday or every month. It does not guarantee profits or prevent losses, but it helps beginners avoid the pressure of picking the perfect day to invest.
Example: an investor contributes $500 per month for 30 years. At a hypothetical 10% annual return compounded monthly, the contributions could grow to roughly $1.13 million before taxes and fees. At lower returns, the result would be meaningfully lower. The lesson is not that 10% is guaranteed. The lesson is that saving rate, time, cost, and discipline matter together.
Actionable beginner rule Use automatic contributions when possible. A simple monthly investing plan can reduce decision fatigue and help you stay consistent during both good and bad markets.
8. S&P 500 Average Return vs. Bonds, Cash, and Savings Accounts
Stocks have historically offered higher long-term returns than cash and many bonds because stock investors accept more risk. That risk includes sharp losses, long recovery periods, and no guaranteed outcome. Cash feels safer in the short term, but it may lose purchasing power after inflation. Bonds can reduce portfolio swings, but they can also lose value when interest rates rise.
| Asset type | Typical role | Main advantage | Main risk |
|---|---|---|---|
| S&P 500 index fund | Long-term growth | Higher historical return potential | Large short-term losses are possible |
| U.S. bond fund | Stability and income | Can reduce portfolio volatility | Interest-rate and credit risk |
| High-yield savings/cash | Emergency fund and short-term needs | Stable dollar value and liquidity | May not beat inflation over long periods |
| International stock fund | Diversification beyond U.S. companies | Less dependence on one country | Currency and country-specific risks |
| Target-date fund | All-in-one retirement portfolio | Automatic asset allocation glide path | Expense ratio and underlying allocation vary |
9. Future Expectations: What Should Investors Expect Now?
A responsible article should not pretend to know the future. The honest answer is: future S&P 500 returns are uncertain. Long-term expectations depend on starting valuation, earnings growth, inflation, interest rates, profit margins, taxes, productivity, technology, and investor sentiment.
Current capital market assumption models from large firms are forecasts, not guarantees. Vanguard notes that its forecasts are hypothetical, depend on current market conditions, and can change over time. It also warns that valuations are poor predictors over short or intermediate periods and should not be the main reason for changing allocations. J.P. Morgan Asset Management frames its long-term assumptions around a changing macro backdrop, resilient profits, higher yields, and portfolio construction trade-offs.
For beginners, a practical planning range is often more useful than one exact number. Instead of assuming the S&P 500 will always return 10%, consider testing your plan at 4%, 6%, 8%, and 10%. If your retirement plan only works at the highest assumption, the plan may be fragile.
Figure 3: Ten-year results have varied widely
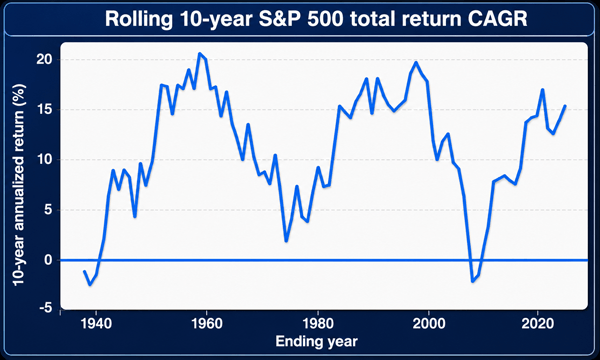
Figure note: A rolling 10-year return shows what an investor would have earned over each 10-year window. Even decade-long periods can be weak or unusually strong.
| Future return driver | Why it matters | Beginner-friendly interpretation |
|---|---|---|
| Starting valuation | Expensive markets often have lower future expected returns. | Do not panic, but avoid assuming recent high returns will repeat. |
| Earnings growth | Stocks ultimately depend on business profits. | Higher profits can support returns; profit disappointments can hurt. |
| Interest rates | Higher bond yields can compete with stocks. | When safe yields rise, investors may demand more from stocks. |
| Inflation | Inflation reduces real purchasing power. | A 7% return with 4% inflation is not the same as a 7% return with 2% inflation. |
| Investor behavior | Buying high and selling low can destroy returns. | A written plan is often more valuable than a market forecast. |
10. How Beginners Can Use the S&P 500 in a Real Plan
- Define the goal first. Is the money for retirement in 25 years, a house down payment in 3 years, or a child’s education in 10 years? The shorter the timeline, the more careful you should be with stock exposure.
- Keep an emergency fund outside the market. Money needed for rent, medical needs, debt payments, or job loss should not depend on short-term stock prices.
- Choose the right account. A 401(k), IRA, Roth IRA, taxable brokerage account, or education account can change taxes and withdrawal rules.
- Compare expense ratios. A low-cost S&P 500 ETF or index mutual fund leaves more of the gross market return in your pocket.
- Decide the allocation. A 25-year-old may hold more stocks than someone retiring next year, but risk tolerance and life situation matter.
- Automate contributions. Automatic investing reduces the temptation to wait for the perfect time.
- Rebalance periodically. If stocks rise a lot, your portfolio may become riskier than intended. If stocks fall, rebalancing may force you to buy low.
- Review annually, not daily. The S&P 500 can move every minute, but long-term investors do not need to react to every headline.
11. Common Beginner Mistakes
| Mistake | Why it hurts | Better practice |
|---|---|---|
| Expecting 10% every year | Average returns are not smooth yearly returns. | Expect volatility and use a long time horizon. |
| Investing short-term money | A market drop can happen right when you need cash. | Keep near-term money in cash or safer vehicles. |
| Ignoring fees | Small annual fees compound against you. | Prefer low-cost index funds when suitable. |
| Panic selling | Selling after a crash can lock in losses. | Create a written plan before the next bear market. |
| Being U.S.-only by accident | The S&P 500 is not the whole world. | Consider whether international diversification fits your plan. |
| Chasing recent winners | Hot sectors can reverse. | Use broad diversification rather than performance chasing. |
| Ignoring taxes | Tax drag can reduce net returns. | Use tax-advantaged accounts and tax-efficient fund placement when appropriate. |
12. Mini Case Studies: Realistic Investor Experiences
12.1 Case 1: The nervous beginner
A beginner invests $200 per month into an S&P 500 index fund. After six months, the account is down. This feels like failure, but it is normal. The better question is whether the investor has a multi-year plan, an emergency fund, and a contribution schedule. A temporary loss is not automatically a broken strategy.
12.2 Case 2: The high-income professional
A high-income investor uses a 401(k), backdoor Roth IRA strategy where appropriate, and a taxable brokerage account. For this person, tax-efficient investing, expense ratios, and asset location may matter as much as fund selection. This is where a qualified financial advisor or tax professional can add value, especially when stock options, business income, or estate planning are involved.
12.3 Case 3: The near-retiree
A 62-year-old with most wealth in the S&P 500 has enjoyed strong growth, but the risk is sequence-of-returns risk: a large decline early in retirement can damage withdrawals. This investor may need bonds, cash reserves, a retirement income plan, and withdrawal rules rather than a 100% stock portfolio.
13. S&P 500 ETF vs. S&P 500 Mutual Fund
| Feature | ETF | Mutual fund |
|---|---|---|
| Trading | Trades during the day like a stock | Trades once per day after market close |
| Minimum investment | Often one share or fractional share | Varies by fund and platform |
| Automatic investing | Available at some brokers, but not always | Often easier for recurring contributions |
| Tax efficiency | Often strong in taxable accounts | Can be tax-efficient, but structure matters |
| Best fit | Brokerage investors who like flexibility | Retirement plans and automatic investors |
14. How to Evaluate an S&P 500 Fund
- Expense ratio: lower is generally better, all else equal.
- Tracking error: the fund should closely match the index before fees.
- Assets and liquidity: large funds usually trade efficiently.
- Bid-ask spread: ETF buyers should avoid unnecessary trading costs.
- Tax efficiency: especially important in taxable brokerage accounts.
- Brokerage availability: some funds trade commission-free on certain platforms.
- Account fit: the best fund in a taxable account may not be the best choice inside a 401(k).
15. FAQs
15.1 What is the average return of the S&P 500?
Historically, the S&P 500 has compounded around 10% per year before inflation over very long periods, depending on the exact starting date and data method. From 1928-2025, the total return data used here compounded at about 10.0% per year. Since 1957, it compounded at about 10.6% per year.
15.2 Is the S&P 500 safe for beginners?
It is simple, diversified, and low cost when accessed through an index fund, but it is not “safe” in the sense of guaranteed. It can lose 30%, 40%, or more during severe bear markets.
15.3 Can I lose money in an S&P 500 index fund?
Yes. An S&P 500 fund owns stocks, and stock prices can fall. The longer your time horizon, the more time you have to recover, but recovery is never guaranteed on your personal schedule.
15.4 Should I invest a lump sum or monthly?
Historically, lump-sum investing often wins when markets rise, but monthly investing can feel easier and reduce regret. The best choice may depend on your risk tolerance and cash needs.
15.5 Is the S&P 500 enough for retirement?
It can be a major building block, but retirement planning may also require bonds, cash reserves, international diversification, tax planning, insurance, and withdrawal strategy.
15.6 What is the difference between nominal and real return?
Nominal return is the headline return before inflation. Real return is what remains after inflation. Real return is closer to the increase in purchasing power.
15.7 Does the S&P 500 include dividends?
The price index does not include dividends. Total-return calculations include dividends, usually assuming they are reinvested.
15.8 What return should I use in a retirement calculator?
Use a range. Testing 4%, 6%, 8%, and 10% can show whether your plan is resilient. Avoid relying only on the most optimistic number.
16. Honest Bottom Line
The S&P 500 average return is useful, but it is not a magic number. The best way to understand it is to separate history from expectations. History says patient investors in broad U.S. stocks were rewarded over long periods. Expectations say future results may be lower, higher, or uneven, especially when valuations, inflation, interest rates, and earnings conditions change.
For a beginner, the practical lesson is simple: use low-cost diversified funds, keep short-term money out of stocks, invest consistently, understand taxes and fees, and build a plan you can stick with during bad markets. The S&P 500 can be a powerful investing tool, but it works best as part of a disciplined financial plan, not as a prediction machine.
Sources Consulted and Checked
The following sources were consulted and checked while preparing this article and verifying its explanations, historical figures, and forward-looking context.
- S&P Dow Jones Indices / FRED: S&P 500 notes describe the index as a daily close price index and a gauge of the large-cap U.S. equities market. FRED notes that this price index does not contain dividends.
- Aswath Damodaran, NYU Stern: Historical Returns on Stocks, Bonds and Bills, 1928-2025. Used for annual S&P 500 total returns including dividends and inflation-adjusted calculations.
- Investor.gov, U.S. Securities and Exchange Commission: Compound Interest Calculator and investor education materials.
- Vanguard Capital Markets Model forecasts, March 31, 2026: Used for discussion of future return uncertainty, forecast limitations, and valuation warnings.
- J.P. Morgan Asset Management 2026 Long-Term Capital Market Assumptions: Used for broad context on capital market assumptions, macro conditions, and portfolio construction.
- Investopedia S&P 500 historical return overview: Used for cross-checking beginner explanations, index mechanics, and headline historical average context.
Reader Advice
This article is provided solely for educational and general informational purposes. It does not constitute personalized investment, financial, tax, accounting, or legal advice, and it should not be treated as a recommendation to buy, sell, or hold any security or financial product. Historical returns, hypothetical illustrations, forecasts, and planning assumptions are not guarantees of future performance. Market conditions, inflation, interest rates, valuations, tax rules, fund costs, index methodology, laws, regulations, and individual circumstances may change over time.
Before making any financial decision, readers should verify current facts and figures through official and reliable sources, review the latest fund documents and applicable rules, consider their goals, time horizon, risk tolerance, liquidity needs, and tax position, and consult an appropriately qualified professional where necessary. Investing involves risk, including possible loss of principal.