What Is the Yield Curve? Why Investors Watch It Closely
The yield curve sounds like something only bond traders discuss, but it affects ordinary investors more than most people realize. It can influence mortgage rates, savings account yields, bond fund returns, stock market sentiment, bank lending, and the way investors think about recession risk.
At its simplest, the yield curve answers one question: how much does the market want to be paid for lending money for different lengths of time? If investors demand more yield for lending for 10 or 30 years than for a few months, the curve usually slopes upward. If investors accept lower long-term yields than short-term yields, the curve can invert. That inversion is why the yield curve often appears in financial headlines.
This guide explains the yield curve in plain English, with practical examples for beginner investors. Use it to understand the signal, ask better questions, and avoid common mistakes.
Quick answer: The yield curve is a line chart that compares bond yields across different maturities, such as 3-month, 2-year, 10-year, and 30-year Treasury securities. Investors watch it because it shows how the market is pricing interest rates, inflation, growth, and recession risk. A normal curve slopes upward. A flat curve signals uncertainty. An inverted curve, where short-term yields are higher than long-term yields, has often appeared before U.S. recessions, although it is not a perfect timing tool.
1. What Is the Yield Curve?
The yield curve is a graph. The vertical axis shows yield, which is the annual return investors expect from a bond. The horizontal axis shows maturity, which is the length of time until the bond pays back its principal. When people say “the yield curve,” they usually mean the U.S. Treasury yield curve because Treasury securities are widely used as a benchmark for “risk-free” rates in U.S. dollar markets.
Think of it like a menu of interest rates. A 3-month Treasury bill has one yield. A 2-year Treasury note has another. A 10-year Treasury note and 30-year Treasury bond have their own yields. Plot those points on a chart and connect them. That line is the yield curve.
The U.S. Treasury publishes daily yield curve rates based on market quotes for Treasury securities. These rates are commonly used by investors, banks, economists, and financial journalists as a snapshot of market expectations.
| Term | Plain-English meaning | Example |
|---|---|---|
| Yield | The return an investor expects from a bond, usually shown as an annual percentage. | A 10-year Treasury yielding 4.50% means the market return is around 4.50% per year if held as priced. |
| Maturity | How long until the bond pays back principal. | 3 months, 2 years, 10 years, or 30 years. |
| Curve | The line connecting yields for multiple maturities. | A chart of 3-month to 30-year Treasury yields. |
| Spread | The gap between two yields. | 10-year yield minus 2-year yield, or 10-year yield minus 3-month yield. |
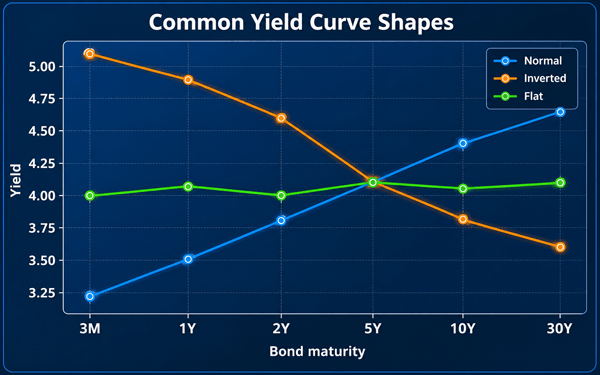
Figure 1. Illustrative comparison of normal, flat, and inverted yield-curve shapes across selected maturities.
2. How the Yield Curve Works
A bond is basically a loan. When you buy a bond, you lend money to the issuer. In return, the issuer promises interest payments and repayment of principal at maturity. The yield changes because bond prices move in the market. When a bond’s price rises, its yield falls. When a bond’s price falls, its yield rises.
The yield curve changes every business day because investors constantly update their views about inflation, Federal Reserve policy, economic growth, credit conditions, and demand for safe assets. Short-term yields are usually more sensitive to central-bank policy. Long-term yields are usually more sensitive to long-run inflation, growth expectations, and investor demand for long-term bonds.
A beginner-friendly way to remember it: short-term yields often reflect what the central bank is doing now; long-term yields often reflect what investors think the economy and inflation may look like later.
| Part of the curve | What it often reflects | Why it matters |
|---|---|---|
| Short end: 3 months to 2 years | Central-bank policy, near-term inflation, money-market demand | Affects savings yields, short-term Treasury bills, floating-rate loans, and cash-like investments. |
| Middle: 3 to 7 years | Expected path of policy rates and growth over the next business cycle | Important for bond ladders and intermediate-term bond funds. |
| Long end: 10 to 30 years | Long-term inflation expectations, growth, debt supply, pension demand, term premium | Influences mortgages, long-term borrowing costs, and duration risk. |
3. Main Types of Yield Curves
The shape of the yield curve is what investors watch most closely. The shape is not a magic forecast, but it gives clues about how bond investors are pricing the future.
| Curve shape | What it looks like | Common message | Investor takeaway |
|---|---|---|---|
| Normal yield curve | Long-term yields are higher than short-term yields. | Markets expect growth and want extra yield for lending longer. | Often supports a normal bond ladder and diversified portfolio approach. |
| Steep yield curve | Long-term yields are much higher than short-term yields. | Markets may expect stronger growth, higher inflation, or future rate increases. | Long bonds may carry more price risk if yields rise further. |
| Flat yield curve | Short- and long-term yields are close together. | Markets are uncertain or transitioning between cycles. | Do not stretch for yield blindly; compare risk and maturity carefully. |
| Inverted yield curve | Short-term yields are higher than long-term yields. | Markets may expect slower growth, future rate cuts, or recession risk. | Be cautious with credit risk, but do not sell everything based on one signal. |
| Humped curve | Middle maturities yield more than short and long maturities. | Markets may expect near-term tight policy but lower rates later. | Useful reminder that the curve is not always a simple straight line. |
4. Why Investors Watch the Yield Curve Closely
Investors watch the yield curve because it condenses a large amount of market information into one picture. It does not tell the future perfectly, but it helps investors understand the current market debate.
The curve matters for five practical reasons. First, it reflects expectations for interest rates. Second, it can influence borrowing costs. Third, it affects bond prices and bond fund returns. Fourth, it shapes bank profitability because banks often borrow short and lend long. Fifth, an inversion has historically been associated with higher recession risk, especially when measured by spreads such as the 10-year Treasury yield minus the 3-month Treasury bill yield.
| Reason investors watch it | Practical example |
|---|---|
| Interest-rate expectations | If the 2-year yield rises quickly, the market may be pricing tighter central-bank policy. |
| Mortgage and loan rates | Long-term Treasury yields help influence long-term borrowing costs, including fixed mortgage rates. |
| Bond fund risk | When yields rise, existing bond prices usually fall; longer-duration funds tend to be more sensitive. |
| Stock market sentiment | A deeply inverted curve can make investors more defensive because it suggests slower growth risk. |
| Recession monitoring | The New York Fed uses the yield curve slope in a model estimating recession probability 12 months ahead. |
5. Does an Inverted Yield Curve Mean a Recession Is Coming?
An inverted yield curve is one of the most famous recession warning signs, but it should be treated as a warning light, not a countdown clock. It can be early. It can give false signals. And even when it is right about economic stress, markets may move in surprising ways before a recession officially starts.
The logic is simple. If short-term yields are high because policy is tight, but long-term yields are lower because investors expect future rate cuts and weaker growth, the curve can invert. That does not automatically create a recession, but it can reflect the type of financial conditions that often appear before one.
One reason beginners get confused is timing. The stock market can rally during part of an inversion, and the economy can look fine for months. The signal is more about cycle risk than day-to-day trading. A sensible investor uses it with other indicators such as unemployment trends, credit spreads, earnings revisions, inflation data, and central-bank guidance.
| Myth | Better way to think about it |
|---|---|
| “An inversion means sell all stocks immediately.” | No. It means review risk, liquidity, debt, and diversification. Market timing based on one signal can be costly. |
| “The curve predicts the exact recession date.” | No. It is a broad indicator, not a calendar. The lead time can vary widely. |
| “If no recession happens quickly, the signal failed.” | Not necessarily. The curve may warn early, or other forces may offset the slowdown. |
| “All inversions are the same.” | No. Depth, duration, central-bank policy, credit conditions, and inflation backdrop all matter. |
6. Practical Example: Reading the Curve Like a Beginner Investor
Imagine Treasury yields look like this: 3-month yield 5.00%, 2-year yield 4.60%, 10-year yield 4.00%, and 30-year yield 4.10%. The curve is inverted from short maturities to the 10-year point because short-term yields are higher than long-term yields.
What does that suggest? It may suggest investors expect today’s high short-term rates to fall later. That could happen because inflation cools, the central bank cuts rates, growth slows, or investors seek safety in long-term Treasuries. For a beginner, the key is not to jump to a dramatic conclusion. The practical response is to ask better questions.
- Am I holding too much long-duration bond exposure for my risk tolerance?
- Do I have enough emergency cash before taking more market risk?
- Am I reaching for high-yield bonds just because Treasury bills look attractive?
- Could a simple Treasury bill ladder or diversified bond fund fit my goal better?
- Are my stock holdings too concentrated in economically sensitive sectors?
7. How Beginner Investors Can Use the Yield Curve
Beginners do not need to trade the yield curve like professionals. The practical use is portfolio awareness. The curve helps you compare reward, risk, and time horizon.
| Investor goal | How the yield curve helps | Practical action |
|---|---|---|
| Emergency cash | Shows what short-term Treasury bills and money-market instruments may yield. | Keep emergency money liquid; do not lock it up just for a slightly higher yield. |
| Saving for 1-3 years | Helps compare short Treasury bills, CDs, and short-term bond funds. | Match maturity to the date you need the money. Avoid long-duration risk for near-term goals. |
| Retirement income | Shows whether longer bonds pay enough extra yield for added duration risk. | Consider a bond ladder or diversified core bond exposure instead of guessing one maturity. |
| Stock allocation | Signals whether growth risk may be rising. | Rebalance, diversify, and avoid overconcentration rather than panic-selling. |
| Mortgage decision | Long-term yields influence fixed-rate mortgage trends. | Compare fixed vs adjustable-rate risk and avoid assuming rates only move one way. |
8. Practical Strategies Linked to the Yield Curve
8.1 Bond Laddering
A bond ladder spreads money across several maturities. For example, instead of putting all money into a 5-year bond, an investor might buy 1-year, 2-year, 3-year, 4-year, and 5-year Treasuries. As each bond matures, the investor can reinvest at current rates. This reduces the pressure to predict the perfect maturity.
8.2 Barbell Strategy
A barbell holds very short-term bonds on one side and longer-term bonds on the other, with less in the middle. It can offer liquidity plus some long-term yield exposure, but the long side still carries interest-rate risk.
8.3 Bullet Strategy
A bullet strategy focuses maturities around a specific future date. This can help when an investor knows when money will be needed, such as a tuition payment or planned home purchase.
8.4 Duration Management
Duration estimates how sensitive a bond or bond fund is to changes in yields. When the curve is volatile, duration matters. A fund with longer duration can gain more if yields fall, but it can also lose more if yields rise.
8.5 Credit Quality Discipline
When Treasury yields are high, some investors chase even higher yields in low-quality bonds. The yield curve can help you ask whether you are being paid enough for credit risk. Extra yield is not free money; it is compensation for additional risk.
9. Yield Curve vs. Other Market Indicators
| Indicator | What it measures | Strength | Limitation |
|---|---|---|---|
| Yield curve | Difference between yields across maturities. | Simple, market-based, historically useful. | Can be early and is not a complete forecast. |
| Credit spreads | Extra yield on corporate bonds over Treasuries. | Good for tracking stress in company borrowing. | Can stay calm until conditions deteriorate quickly. |
| Stock indexes | Market value of listed companies. | Forward-looking and easy to track. | Can be driven by sentiment and a few large stocks. |
| Unemployment rate | Labor-market health. | Important for confirming economic weakness. | Often lags; it may rise after slowdown begins. |
| Inflation data | Price pressure in the economy. | Key for central-bank policy. | Backward-looking and revised over time. |
10. Beginner Checklist: How to Read the Yield Curve in 5 Minutes
- Look at the overall shape: upward, flat, inverted, or humped.
- Check the 10-year minus 2-year spread and the 10-year minus 3-month spread.
- Ask whether short-term yields are moving because of central-bank policy.
- Ask whether long-term yields are moving because of inflation, growth, debt supply, or safe-haven demand.
- Compare the curve with credit spreads, unemployment, inflation, and stock-market breadth.
- Translate the signal into portfolio risk management, not emotional trading.
11. Common Mistakes to Avoid
| Mistake | Why it hurts | Better practice |
|---|---|---|
| Using the yield curve as a trading signal only | It can be early or noisy. | Use it as one part of a broader risk dashboard. |
| Ignoring duration | Yield alone does not show price sensitivity. | Check duration before buying bond funds or long bonds. |
| Chasing the highest yield | Higher yield may mean higher credit, liquidity, or duration risk. | Compare risk-adjusted return, not headline yield. |
| Assuming all bonds are safe | Bond prices can fall when yields rise. | Match bond type and maturity to your goal. |
| Forgetting taxes and fees | After-tax return may differ from quoted yield. | Compare after-tax yields and expense ratios. |
12. Frequently Asked Questions
12.1 What Is the Yield Curve in One Sentence?
The yield curve is a chart showing the yields investors earn on bonds of the same credit quality but different maturities.
12.2 Why Is the Treasury Yield Curve Watched So Closely?
Treasury yields are a benchmark for many financial markets, and the curve reflects expectations for interest rates, inflation, growth, and recession risk.
12.3 What Is the Most Important Yield Curve Spread?
Many investors watch the 10-year minus 2-year Treasury spread, while the New York Fed’s recession probability model focuses on the 10-year minus 3-month spread.
12.4 Is an Inverted Yield Curve Always Bad?
It is a caution signal, not an automatic disaster. It often suggests tighter financial conditions and slower-growth risk, but timing and context matter.
12.5 Can Beginners Invest Using the Yield Curve?
Yes, but mainly for risk awareness. Beginners can use it to choose suitable maturities, avoid excessive duration, build ladders, and keep portfolios diversified.
12.6 How Often Should I Check the Yield Curve?
Most long-term investors do not need to check it daily. Monthly or during major central-bank and inflation updates is usually enough for educational monitoring.
12.7 Does the Yield Curve Affect Mortgage Rates?
Yes. Mortgage rates are influenced by longer-term interest rates, inflation expectations, credit conditions, and lender margins. The 10-year Treasury yield is often watched as a rough benchmark.
12.8 What Is a Normal Yield Curve?
A normal curve slopes upward, meaning longer-term bonds offer higher yields than shorter-term bonds.
12.9 What Is a Flat Yield Curve?
A flat curve means yields across maturities are close together. It often appears during transitions or uncertainty about future policy and growth.
12.10 What Is Yield Curve Control?
Yield curve control is a central-bank policy where authorities target yields at specific maturities. It is different from simply observing the market yield curve.
13. Responsible Investor Guidance
The yield curve is useful, but it should not be used to scare readers into buying or selling financial products. Honest investing content should explain risk, uncertainty, and alternatives. No chart can promise returns. No recession indicator works perfectly. And no beginner should take concentrated risk based only on a headline about the curve.
A practical approach is to use the curve as a conversation starter: review your time horizon, liquidity needs, debt exposure, bond duration, credit risk, and diversification. If the decision involves retirement savings, tax planning, or large financial commitments, consider speaking with a qualified financial professional who understands your full situation.
Sources Consulted and Checked
The following sources were consulted and checked while preparing this article to support clarity and accuracy:
- U.S. Department of the Treasury, Interest Rate Statistics and Daily Treasury Yield Curve Rates.
- Federal Reserve Bank of New York, The Yield Curve as a Leading Indicator and recession probability model.
- FINRA, Understanding Bond Yield and Return.
- Reserve Bank of Australia, Bonds and the Yield Curve explainer.
- Federal Reserve Bank of Chicago, research on why the yield-curve slope predicts recessions.
- Fidelity and Charles Schwab educational materials on bond yield curves and fixed income investing.
Reader Advice
This article is provided solely for educational and informational purposes. It does not constitute personalized investment, financial, tax, legal, or other professional advice, and it should not be treated as a recommendation to buy, sell, or hold any security or financial product.
Financial markets, interest rates, economic conditions, laws, regulations, tax rules, and institutional policies may change, and outcomes can differ according to an investor’s circumstances, objectives, time horizon, and risk tolerance. Before making a financial decision, verify current facts, figures, rates, and rules through relevant official or primary sources and consider seeking advice from an appropriately qualified professional who can assess your individual situation. Past patterns, including the historical behavior of the yield curve, do not guarantee future results.