Leading Economic Indicators Every Investor Should Know
1. Introduction: why investors watch the economy before headlines catch up
Most beginners first notice the economy through headlines: “stocks fall,” “inflation rises,” “jobs report beats expectations,” or “recession fears return.” By the time those headlines appear, markets may have already moved. Leading economic indicators help investors look a few months ahead instead of only reacting to yesterday’s news.
A leading economic indicator is a data point that often changes before the broader economy changes. It is not a crystal ball. It is more like a weather forecast. A dark sky does not guarantee rain, but it tells you to carry an umbrella. In investing, that umbrella may be a more balanced portfolio, extra cash, better diversification, or simply more patience before taking a large new position.
For a beginner, the goal is not to become an economist. The goal is to answer practical questions: Is the economy gaining strength or losing momentum? Are companies likely to sell more or less in the next few quarters? Are consumers confident or stressed? Is credit easy or tight? Are investors being paid enough for the risk they are taking?
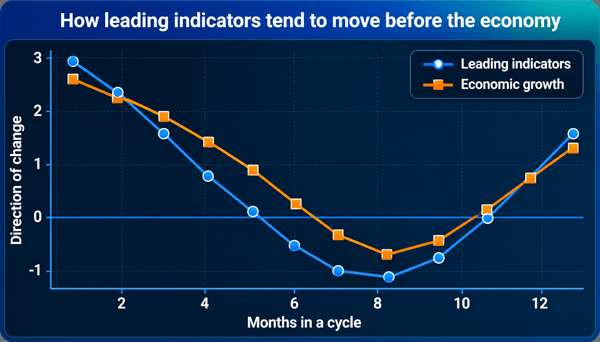
Figure 1: Leading indicators are useful because they often weaken or improve before the broad economy does. The exact timing varies, which is why investors should use a dashboard rather than a single signal.
2. What are leading economic indicators?
Leading economic indicators are forward-looking measures that tend to move before the overall economy, company earnings, unemployment, or consumer spending fully change. They are called “leading” because they lead the cycle. They are different from coincident indicators, which describe what is happening now, and lagging indicators, which confirm what already happened.
| Type | Simple meaning | Examples | How investors use it |
|---|---|---|---|
| Leading indicators | Move before the economy changes | Yield curve, building permits, PMI new orders, initial jobless claims, consumer expectations, stock prices, credit spreads | Prepare for possible changes in growth, earnings, interest rates, and risk appetite |
| Coincident indicators | Move with the current economy | Industrial production, retail sales, employment, personal income | Check whether current conditions are strong or weak |
| Lagging indicators | Move after the economy has already changed | Unemployment rate, corporate profits, consumer loan delinquencies | Confirm a trend and avoid denying reality |
The Conference Board Leading Economic Index (LEI) is one of the best-known composite indexes. It combines ten U.S. indicators, including manufacturing hours, jobless claims, new orders, building permits, stock prices, credit conditions, the interest-rate spread, and consumer expectations. In May 2026, The Conference Board reported that the U.S. LEI rose 0.1% to 99.3 after a 0.2% increase in April, but it was still slightly lower over the prior six months. [1]
3. How leading indicators work in real life
The economy works through chains of decisions. A consumer feels worried, so they delay buying a car. A company sees weaker orders, so it slows production. A builder sees fewer buyers, so it applies for fewer permits. A bank sees higher risk, so it tightens lending. These small decisions show up in data before they become obvious in GDP or earnings reports.
Markets care about these early signs because stock prices usually discount the future. If investors expect earnings to fall six months from now, prices may start falling before the earnings decline appears. If the economy is weak but indicators begin improving, markets may recover before the news feels good.
This is why many experienced investors say: “The market turns before the economy turns.” That sentence is not always true day by day, but it captures an important idea. Investors should watch the direction and combination of indicators, not only the current level of the economy.
4. The most important leading economic indicators investors should know
4.1 The yield curve
The yield curve compares interest rates on short-term and long-term government bonds. A common version is the 10-year Treasury yield minus the 3-month Treasury bill yield. Normally, long-term bonds pay more than short-term bills because investors demand extra return for lending money longer. When short-term rates rise above long-term rates, the curve is “inverted.”
Why it matters: an inverted curve often means monetary policy is tight and investors expect slower future growth or lower future rates. The New York Fed describes the term spread as a tool used to estimate the probability of a U.S. recession twelve months ahead. [5]
Practical use: do not sell everything just because the curve inverts. Instead, treat it as a risk-management signal. Review portfolio concentration, avoid excessive leverage, and check whether cyclical stocks, speculative growth stocks, and lower-quality bonds have become too large in your portfolio.
4.2 Purchasing Managers’ Index (PMI) and new orders
PMI surveys ask purchasing managers whether business activity is improving, worsening, or staying the same. The new orders component is especially useful because orders come before production, revenue, and hiring.
Why it matters: a PMI above 50 generally signals expansion in that sector, while below 50 signals contraction. ISM reported that its Manufacturing New Orders Index expanded in May 2026 at 56.8, up from 54.1 in April. The index remained in expansion territory in June 2026 at 56.0. [6]
Practical use: rising new orders may support industrials, materials, transports, semiconductors, and small caps. Falling new orders can warn that earnings estimates may be too optimistic.
4.3 Initial unemployment claims
Initial jobless claims measure how many people filed for unemployment benefits for the first time. It is one of the timeliest labor-market indicators because it is released weekly.
Why it matters: unemployment itself is often lagging, but claims can turn earlier. A steady rise in claims may suggest employers are becoming cautious before the unemployment rate moves sharply.
Practical use: compare the latest claims with the four-week average. One noisy week means little. A persistent uptrend is more important, especially if it appears together with weaker consumer confidence and falling new orders.
4.4 Building permits and housing starts
Building permits are approvals for future construction. Housing starts show construction that has begun. Permits often lead starts because builders need approval before breaking ground.
Why it matters: housing is interest-rate sensitive and connected to many industries: banks, building materials, furniture, appliances, labor, local taxes, and consumer wealth. FRED notes that housing permits are included in leading-index models for state economic activity. [3]
Practical use: falling permits can signal slower demand for homebuilders, mortgage lenders, lumber, furniture, and local services. Rising permits after a downturn can signal early recovery.
4.5 Consumer expectations and confidence
Consumer confidence surveys ask households how they feel about jobs, income, business conditions, and future spending. Expectations matter because consumer spending is a major part of the U.S. economy.
Why it matters: when households feel secure, they are more willing to buy homes, cars, travel, and discretionary goods. When they feel stressed, they may save more and delay big purchases.
Practical use: use confidence with hard data. A weak confidence reading is more serious when credit-card delinquencies rise, jobless claims rise, and retailers report weaker sales.
4.6 Stock market breadth and major indexes
Stock prices are included in several leading indicator frameworks because equity markets respond quickly to expectations for earnings, rates, liquidity, and risk.
Why it matters: the S&P 500 can rise even when only a few mega-cap stocks are strong. Breadth asks whether many stocks are participating or only a small group is carrying the market.
Practical use: if the index is making highs but fewer stocks are above their 200-day moving averages, risk may be building under the surface. Broad participation is healthier than narrow leadership.
4.7 Credit spreads and lending conditions
Credit spreads measure the extra yield investors demand to own corporate bonds instead of safer government bonds. Wider spreads usually mean investors want more compensation for default risk.
Why it matters: credit markets often notice stress before equity investors do. Tight credit spreads suggest confidence and liquidity; widening spreads suggest stress, tighter financing, and possible pressure on earnings.
Practical use: widening high-yield spreads are a warning for leveraged companies, private credit, banks, and small caps. Narrow spreads may support risk assets, but extremely tight spreads can also signal complacency.
4.8 Durable goods and capital-goods orders
Durable goods are long-lasting products such as machinery, vehicles, and equipment. Nondefense capital goods excluding aircraft is often watched as a proxy for business investment.
Why it matters: companies order equipment when they expect demand. If orders fall, management teams may be delaying expansion.
Practical use: stronger capital-goods orders can support industrial automation, machinery, logistics, and business-services themes. Weak orders can warn that corporate investment is slowing.
4.9 Inflation expectations and commodity signals
Inflation itself can be coincident or lagging, but market-based and survey-based inflation expectations can lead policy decisions and asset prices.
Why it matters: if inflation expectations rise, central banks may keep rates higher for longer. That can pressure long-duration assets, expensive growth stocks, real estate, and highly leveraged companies.
Practical use: watch energy prices, wage pressure, inflation expectations, and central-bank language together. A single oil spike is not the same as broad, persistent inflation pressure.
4.10 The U.S. dollar and global trade indicators
The dollar often strengthens when global investors seek safety or when U.S. rates are attractive. Export orders, shipping rates, and global PMIs help investors read international demand.
Why it matters: a strong dollar can reduce translated overseas earnings for U.S. multinationals and pressure emerging markets with dollar debt.
Practical use: dollar strength can help importers but hurt exporters and commodity-linked markets. Global investors should watch currency trends alongside country allocation and foreign-stock exposure.
5. Quick comparison table: what each indicator tells you
| Indicator | What it usually leads | Bullish sign | Bearish sign | Best paired with |
|---|---|---|---|---|
| Yield curve | Recession risk, rate-cycle shifts | Curve steepens after policy easing with improving data | Deep or persistent inversion; later steepening caused by rising credit stress | Credit spreads, jobless claims |
| PMI new orders | Production and earnings | New orders above 50 and rising | New orders below 50 or falling quickly | Inventories, earnings guidance |
| Initial jobless claims | Labor weakness | Claims low or falling | Claims rising for several weeks | Consumer confidence, retail sales |
| Building permits | Housing activity | Permits rising after a slowdown | Permits falling with high mortgage rates | Mortgage rates, builder sentiment |
| Consumer expectations | Spending appetite | Expectations improving | Expectations falling with job anxiety | Wage growth, delinquencies |
| Credit spreads | Financial stress | Spreads stable or narrowing | Spreads widening sharply | Bank lending, default rates |
| Stock breadth | Market durability | Many sectors participating | Index rises on narrow leadership | Earnings revisions, valuations |
6. A practical example: how a beginner can read the indicators
Imagine you are reviewing your retirement portfolio or long-term investment account at the end of a month. You do not need to predict the exact next market move. You simply want to decide whether conditions are improving, neutral, or deteriorating.
- Check the yield curve. If it is inverted, mark the interest-rate backdrop as cautious.
- Check PMI new orders. If new orders are expanding and rising, mark business demand as improving.
- Check jobless claims. If the four-week average is rising, mark labor risk as worsening.
- Check building permits. If permits are falling, mark housing and rate-sensitive sectors as weak.
- Check credit spreads. If spreads are widening, mark market stress as increasing.
- Check whether the stock market rally is broad or narrow. If only a few stocks are rising, avoid assuming the whole market is healthy.
Now combine the signals. If four or five are improving, a beginner may feel more comfortable adding to long-term positions gradually. If four or five are deteriorating, the better action may be to rebalance, reduce speculative exposure, increase quality, keep emergency cash separate from investments, and avoid chasing rallies. This is risk management, not market timing.
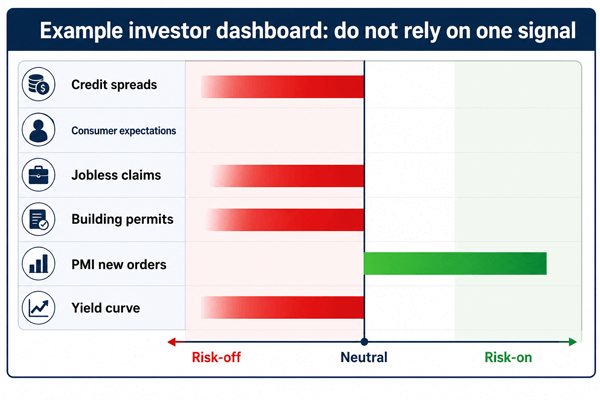
Figure 2: A simple dashboard helps beginners compare several indicators at once instead of reacting emotionally to headlines.
7. How investors can use leading indicators without overtrading
The biggest mistake beginners make is using one indicator as a buy-or-sell button. A better approach is to use indicators as a decision framework.
| Investor decision | How indicators help | Example action |
|---|---|---|
| Asset allocation | Show whether growth, inflation, and credit risk are improving or worsening | Tilt gradually toward quality, defensives, bonds, or cyclicals depending on the data mix |
| Risk management | Warn when recession or liquidity risk is rising | Avoid leverage, review stop-loss rules, rebalance concentrated positions |
| Sector selection | Show which parts of the economy may strengthen first | Housing permits for homebuilders; PMI orders for industrials; credit spreads for banks |
| Entry timing | Reduce emotional buying after headlines | Use dollar-cost averaging when signals are mixed instead of investing all at once |
| Expectation setting | Help investors stay realistic | Do not expect high earnings growth when new orders, housing, and confidence are all weakening |
8. Common beginner mistakes to avoid
- Mistake 1: treating leading indicators as guaranteed predictions. They improve probabilities, not certainty.
- Mistake 2: focusing on the latest number but ignoring the trend. The direction over several months usually matters more than one release.
- Mistake 3: ignoring revisions. Economic data can be revised, so do not build a large investment decision on one preliminary report.
- Mistake 4: mixing time horizons. A trader, a retirement investor, and a business owner may use the same indicator differently.
- Mistake 5: assuming bad economic news always means stocks must fall. If markets already priced in bad news, even slightly better data can cause a rally.
- Mistake 6: reading U.S. indicators as if they explain every country, sector, or asset class equally.
9. Beginner-friendly checklist: the 20-minute monthly routine
| Step | Question to ask | Green signal | Red signal |
|---|---|---|---|
| 1 | Is the yield curve normal or inverted? | Positive spread and improving growth data | Inversion or stress-driven steepening |
| 2 | Are new orders rising? | PMI new orders above 50 and rising | Below 50 or falling fast |
| 3 | Are layoffs increasing? | Initial claims stable or falling | Four-week average rising |
| 4 | Is housing improving? | Permits and starts stabilizing or rising | Permits falling with weak builder sentiment |
| 5 | Are consumers confident? | Expectations improving | Expectations falling and delinquencies rising |
| 6 | Is credit calm? | Spreads stable or narrowing | High-yield spreads widening |
| 7 | Is the market rally broad? | Many sectors and stocks participating | Narrow rally driven by a few names |
After the checklist, write one sentence: “The indicator mix is improving, mixed, or deteriorating.” That sentence is often more useful than reading ten dramatic market opinions.
10. What leading indicators are saying now: how to think, not what to buy
As of the latest available Conference Board release reviewed for this article, the U.S. LEI improved slightly in May 2026, but the six-month trend remained mildly negative. That mix is not a clean “all clear” signal. It suggests investors should watch whether the improvement continues and whether it spreads across orders, housing, credit, labor, and consumer expectations. [1]
This is the honest way to use economic indicators: do not force one month of data into a strong market prediction. Ask whether the weight of evidence is getting better or worse. A portfolio should be built to survive uncertainty, not to depend on perfect forecasts.
11. FAQ: leading economic indicators for investors
11.1 What is the best leading economic indicator?
There is no single best indicator. The yield curve is useful for recession risk, PMI new orders for business momentum, building permits for housing, jobless claims for labor changes, and credit spreads for financial stress.
11.2 Are leading indicators useful for long-term investors?
Yes, but not as short-term trading signals. Long-term investors can use them to rebalance, manage risk, avoid emotional decisions, and understand where they are in the economic cycle.
11.3 How often should beginners check them?
Monthly is enough for most long-term investors. Jobless claims are weekly, but checking everything too often can encourage overtrading.
11.4 Can leading indicators be wrong?
Yes. They can give false signals, arrive early, or be distorted by unusual policy, shocks, or market structure. That is why confirmation across several indicators matters.
11.5 Do economic indicators predict stock market returns?
They help explain the environment, but they do not precisely predict returns. Valuation, earnings, interest rates, liquidity, investor positioning, and surprises also matter.
11.6 Should I sell stocks when indicators weaken?
Not automatically. A beginner should first review diversification, emergency savings, risk tolerance, and time horizon. Selling everything can create tax costs, timing mistakes, and missed recoveries.
12. Final takeaway
Leading economic indicators give investors an early look at the direction of the economy. They are most powerful when used together: yield curve for rate-cycle risk, PMI new orders for business demand, jobless claims for labor stress, building permits for housing, consumer expectations for spending, credit spreads for financial conditions, and market breadth for investor participation.
The practical lesson is simple: do not use economic data to predict the future with false confidence. Use it to prepare. A prepared investor makes calmer decisions, avoids chasing headlines, and builds a portfolio that can handle both expansion and slowdown. That is the real value of leading economic indicators.
Sources Consulted and Checked
The following authoritative sources were consulted and checked while preparing this article and verifying its factual accuracy:
[1] The Conference Board, “US Leading Indicators,” May 2026 release: https://www.conference-board.org/topics/us-leading-indicators/
[2] The Conference Board, “Description of Components”: https://www.conference-board.org/data/bci/index.cfm?id=2160
[3] Federal Reserve Bank of St. Louis FRED, Leading Index notes and components: https://fred.stlouisfed.org/graph/?g=oWC9
[4] FRED, 10-Year Treasury Constant Maturity Minus 3-Month Treasury Constant Maturity: https://fred.stlouisfed.org/series/T10Y3M
[5] Federal Reserve Bank of New York, “The Yield Curve as a Leading Indicator”: https://www.newyorkfed.org/research/capital_markets/ycfaq
[6] Institute for Supply Management, May 2026 Manufacturing PMI Report: https://www.ismworld.org/supply-management-news-and-reports/reports/ism-pmi-reports/pmi/may/
[7] Cleveland Fed, “Yield Curve and Predicted GDP Growth”: https://www.clevelandfed.org/indicators-and-data/yield-curve-and-predicted-gdp-growth
[8] Federal Reserve Board, FEDS Notes, “Predicting Recession Probabilities Using the Slope of the Yield Curve”: https://www.federalreserve.gov/econres/notes/feds-notes/predicting-recession-probabilities-using-the-slope-of-the-yield-curve-20180301.html
Reader Advice
This article is provided solely for educational and informational purposes. It does not constitute personal financial, investment, legal, tax, or accounting advice; a recommendation to buy, sell, or hold any security; or a guarantee of investment results. Economic data, market conditions, regulations, tax rules, interest rates, and official methodologies can change, and published figures may later be revised. Before making any financial decision, readers should verify current facts and figures through the relevant official sources, consider their objectives, risk tolerance, time horizon, liquidity needs, tax circumstances, and personal situation, and seek advice from appropriately qualified professionals where necessary. Past performance and historical relationships between indicators and markets do not guarantee future outcomes.