What Is the VIX? Understanding the Market's Fear Index
1. What is the VIX in simple words?
The VIX, officially the Cboe Volatility Index, is widely called the market’s “fear index” because it tends to rise when investors become nervous and buy protection against sharp stock-market moves. In simple terms, it is a number that shows how much movement the options market expects from the S&P 500 over the next 30 days.
Think of it like a weather forecast for market turbulence. A low VIX is like a calm forecast: investors expect smaller waves. A high VIX is like a storm warning: investors expect bigger swings. But just like a weather forecast, it is not a guarantee. It reflects expectations based on current option prices, and those expectations can change quickly.
The most important beginner point is this: the VIX measures expected volatility, not whether stocks must go up or down. A high VIX usually appears during falling markets because investors demand protection, but the VIX itself is not a magic sell signal or buy signal.
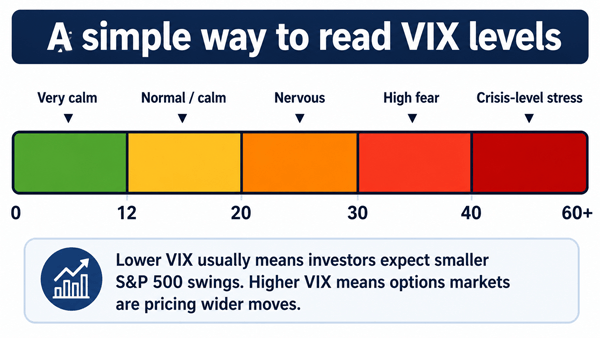
Figure 1: Practical VIX level guide for beginners. These are rough zones, not fixed rules.
Key takeaway: The VIX is not a stock-market direction predictor. It is a live estimate of how much the options market expects the S&P 500 to move over the next 30 days.
2. Why is the VIX called the fear index?
The nickname comes from investor behavior. When people are calm, they are usually less willing to pay high prices for downside protection. When people are scared, they often rush to buy put options or other hedges. That extra demand can lift option prices. Since the VIX is calculated from S&P 500 option prices, it rises when the market is pricing more uncertainty.
This does not mean the VIX measures emotions directly. It measures option prices. The “fear” label is a shortcut. More accurately, the VIX is a market-based estimate of expected S&P 500 volatility over the next month.
Key takeaway: Use “fear index” as a helpful nickname, but remember that VIX is built from real S&P 500 options prices, not surveys, opinions, headlines, or social media sentiment.
3. How the VIX works without complicated math
The VIX is calculated using a wide range of S&P 500 Index options, including puts and calls with roughly one month until expiration. Options are contracts whose prices rise or fall based partly on how much movement traders expect in the underlying index. If traders expect bigger moves, option premiums usually rise. If they expect smaller moves, premiums usually fall.
Cboe’s methodology uses near-term and next-term SPX and SPXW options and standardizes the result into a constant 30-day expected volatility measure. The formula is technical, but the idea is easy: combine option prices across many strike prices, remove some non-volatility effects, and convert the result into an annualized volatility number.
| VIX component | Beginner explanation |
|---|---|
| S&P 500 options | The VIX looks at options on the broad U.S. stock-market benchmark, not one company. |
| Puts and calls | It uses both downside and upside option prices to estimate expected movement. |
| About 30 days | It focuses on near-term expectations, not next year’s market outlook. |
| Annualized number | A VIX of 18 means 18% annualized expected volatility, not an 18% move tomorrow. |
| Forward-looking | It is based on implied volatility from current option prices, not only past price swings. |
4. What does a VIX number actually mean?
A VIX reading is an annualized percentage. For example, VIX 18 means the market is pricing about 18% annualized expected volatility for the S&P 500. To convert that into a rough 30-day expected range, divide the VIX by the square root of 12 because there are about 12 months in a year.
Practical example: if the S&P 500 is at 5,000 and the VIX is 18, the rough 30-day expected volatility is 18% divided by √12, or about 5.2%. A 5.2% move on 5,000 is about 260 points. So the market-implied 30-day range would be roughly 4,740 to 5,260. This is not a promise. It is a statistical estimate implied by options pricing.
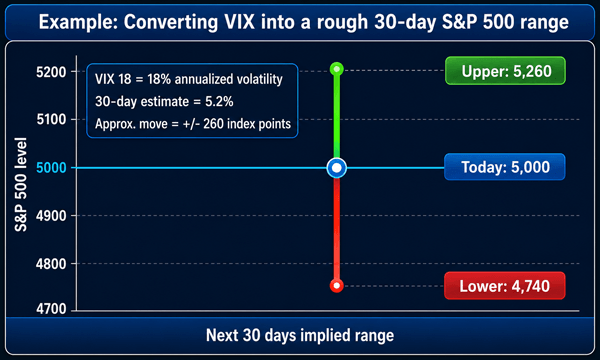
Figure 2: A simple expected-range example using VIX 18 and an S&P 500 level of 5,000.
| VIX level | Rough 30-day expected S&P 500 range | Plain-English reading |
|---|---|---|
| 10 | +/- 2.9% | Very calm; markets may be underpricing risk if bad news appears. |
| 15 | +/- 4.3% | Normal-to-calm conditions. |
| 20 | +/- 5.8% | Noticeable uncertainty; risk management matters more. |
| 25 | +/- 7.2% | Stress is rising; expect wider daily swings. |
| 30 | +/- 8.7% | High fear; markets are pricing large near-term moves. |
| 40 | +/- 11.5% | Crisis-like volatility; avoid emotional decisions. |
5. VIX vs. the S&P 500: why they often move opposite ways
The VIX and the S&P 500 often move in opposite directions. When stocks fall sharply, investors often buy protection, option premiums rise, and the VIX jumps. When stocks recover or become quiet, demand for protection usually cools and the VIX falls. This inverse relationship is common, but not perfect.
A useful beginner habit is to read the VIX together with price action. If the S&P 500 is falling and the VIX is rising quickly, the market is becoming more defensive. If the S&P 500 is rising while the VIX is also rising, traders may be expecting larger moves ahead despite the rally. If the S&P 500 is flat but the VIX is climbing, options traders may be positioning for a catalyst such as inflation data, earnings, central-bank news, or geopolitical risk.
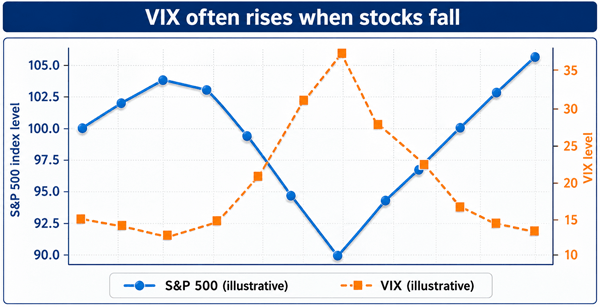
Figure 3: Illustrative pattern showing how VIX often spikes when stocks drop.
6. What is a high or low VIX?
There is no permanent “good” or “bad” VIX level because market conditions change. Still, beginners can use rough zones. Below 15 often suggests a calm market. Around 15 to 20 is often normal. Above 20 suggests more uncertainty. Above 30 is commonly associated with high fear or stress. Above 40 can appear during major shocks, forced selling, financial stress, or crisis conditions.
| Zone | Typical interpretation | Beginner response |
|---|---|---|
| Below 15 | Calm or complacent market | Do not assume low risk. Review diversification and avoid overleveraging. |
| 15-20 | Normal range | Use it as background context, not a trade signal. |
| 20-30 | Elevated uncertainty | Check position sizes, cash needs, and stop-loss or rebalancing rules. |
| 30-40 | High fear | Avoid panic selling; use a written plan. Long-term investors may rebalance carefully. |
| 40+ | Extreme stress | Liquidity, spreads, and emotions matter. Beginners should avoid complex volatility products. |
Experienced investors often learn that very low VIX can be dangerous if it creates overconfidence, while very high VIX can create opportunity if quality assets are being sold indiscriminately. The practical lesson is not “buy low VIX, sell high VIX.” The lesson is to match your risk level to the market environment.
7. How beginners can use the VIX in real life
The best use of the VIX for most beginners is not active trading. It is risk awareness. The VIX can help you understand whether the market is calm, nervous, or panicked. That can improve how you size positions, rebalance, use cash, and avoid emotional decisions.
| Use case | How to use VIX practically | What not to do |
|---|---|---|
| Portfolio risk check | If VIX rises above your comfort zone, review whether your portfolio still matches your risk tolerance. | Do not sell everything only because VIX is high. |
| Rebalancing | During spikes, compare your allocation to your target. Rebalance gradually if your plan says so. | Do not chase “bottoms” with money you need soon. |
| Position sizing | When VIX is high, reduce trade size because daily swings can be larger. | Do not use the same leverage in VIX 35 as in VIX 14. |
| Options awareness | Understand that option premiums tend to be expensive when VIX is high. | Do not buy options without understanding time decay and implied volatility. |
| Market context | Use VIX with trend, valuation, earnings, interest rates, and news. | Do not treat VIX as a complete investing system. |
7.1 A practical investor example
Imagine a beginner investor named Sara with a $50,000 portfolio: 80% stock ETFs and 20% bond funds. The VIX has been around 14 for months, and she feels comfortable. Suddenly, the market sells off and the VIX jumps to 32. Her first emotional reaction is to sell her stock funds. Instead, she checks her written plan.
Her plan says she should keep six months of emergency savings outside the market, invest monthly, and rebalance if her stock allocation falls more than five percentage points below target. After the selloff, her portfolio is 74% stocks and 26% bonds. She does not panic. She uses part of her next scheduled contribution to buy stock ETFs and slowly moves back toward her target.
This is how VIX can help: it warns Sara that the market is stressed, so she acts carefully. It does not tell her the exact bottom. It does not replace her risk tolerance. It simply gives her a better read on market conditions.
8. Can you invest in the VIX directly?
No. You cannot buy the spot VIX index like a stock. You can trade products linked to VIX futures, options, exchange-traded products, and volatility strategies, but these are not the same as owning the VIX itself. This is one of the biggest beginner mistakes.
Many VIX-linked ETFs and ETNs track VIX futures, not the spot VIX number you see in market headlines. Futures-based products can lose value over time when futures are more expensive than near-term contracts, a situation known as contango. Some products are designed for short-term trading, not long-term holding. Read the prospectus, understand the risks, and avoid using them as simple long-term hedges unless you know exactly what you own.
| Product | What it is | Beginner caution |
|---|---|---|
| Spot VIX | The index level quoted in market news. | You cannot buy it directly. |
| VIX futures | Contracts based on expected future VIX settlement values. | They may move differently from spot VIX. |
| VIX options | Options on VIX futures-style settlement mechanics. | Advanced product; pricing can confuse beginners. |
| VIX ETFs/ETNs | Exchange-traded products usually linked to VIX futures. | Not usually suitable for buy-and-hold investing. |
| S&P 500 options | Options investors may use for hedging or income strategies. | Requires understanding Greeks, implied volatility, and risk. |
| Key takeaway: For most readers, the safest first step is to use VIX as a risk dashboard, not as a product to trade. | Key takeaway: For most readers, the safest first step is to use VIX as a risk dashboard, not as a product to trade. | Key takeaway: For most readers, the safest first step is to use VIX as a risk dashboard, not as a product to trade. |
9. Common beginner mistakes with the VIX
| Mistake | Why it hurts | Better approach |
|---|---|---|
| Thinking VIX predicts direction | VIX measures expected movement, not guaranteed direction. | Use it with market trend and fundamentals. |
| Buying VIX products for months | Many volatility products suffer from futures roll costs. | Read the prospectus and understand holding-period risk. |
| Ignoring position size | High VIX means wider swings and faster losses. | Cut trade size when volatility expands. |
| Assuming low VIX means safe market | Calm markets can reverse quickly. | Keep diversification and risk limits. |
| Panic selling at high VIX | High fear often appears after a large move has already happened. | Follow a written investment policy. |
| Using VIX alone | No single indicator captures valuation, earnings, rates, liquidity, and sentiment. | Build a checklist. |
10. How traders read VIX term structure
Beginners do not need to master VIX futures curves, but the concept is useful. Term structure compares short-term VIX futures with longer-term VIX futures. In calm markets, longer-term futures are often higher than near-term futures because investors expect some risk premium over time. This is often called contango. During panic, near-term futures can rise above longer-term futures. This is called backwardation and may show urgent demand for protection.
| Term structure | What it often suggests | Practical meaning |
|---|---|---|
| Contango | Calmer conditions; future volatility priced above spot/near term. | Long VIX futures products may face roll drag. |
| Backwardation | Near-term fear is high. | Market stress is elevated; volatility products may behave sharply. |
| Flattening curve | Risk expectations are changing. | Watch upcoming catalysts and liquidity. |
11. VIX compared with other indicators
| Indicator | What it tells you | How it differs from VIX |
|---|---|---|
| S&P 500 price trend | Whether broad stocks are rising or falling. | VIX tells expected movement, not price direction. |
| Put/call ratio | Whether options activity leans toward puts or calls. | VIX uses option prices across strikes, not only volume. |
| Credit spreads | Stress in corporate bond markets. | Credit can reveal funding stress that VIX may not fully capture. |
| MOVE Index | Treasury bond market volatility. | VIX focuses on U.S. equities, not bonds. |
| News sentiment | Headline mood. | VIX is based on traded option prices, not articles or opinions. |
12. A simple VIX checklist before making investment decisions
- What is the VIX today compared with its recent range?
- Is VIX rising because stocks are falling, or because a specific event is ahead?
- Are my position sizes appropriate for larger daily swings?
- Do I need this money within the next one to three years?
- Am I reacting emotionally, or following a written plan?
- Are option premiums expensive because implied volatility is high?
- Would a gradual rebalance be safer than one all-in decision?
13. Beginner-friendly strategy ideas using the VIX
| Investor type | How VIX can help | Example action |
|---|---|---|
| Long-term ETF investor | Shows when fear is unusually high. | Keep automatic contributions running; rebalance if allocation drifts. |
| Retirement saver | Helps avoid emotional selling during volatility. | Review asset allocation annually, not every scary headline. |
| Active trader | Helps adjust stop distances and position size. | Trade smaller when VIX is elevated. |
| Options trader | Shows when implied volatility is rich or cheap. | Compare option premium to realized volatility and event risk. |
| Cash-heavy investor | Can identify periods when high-quality assets are discounted. | Use staged buying instead of trying to catch the exact low. |
14. Frequently asked questions
14.1 Is a high VIX good or bad?
Neither by itself. A high VIX means the options market expects bigger S&P 500 moves. It can signal risk, but it can also appear near attractive long-term buying opportunities after panic selling. Context matters.
14.2 Does the VIX predict a crash?
No. It can show that the market is pricing more uncertainty, but it does not guarantee a crash. Sometimes VIX rises before a selloff; sometimes it rises after the selloff has already happened.
14.3 What does VIX 20 mean?
It means the market is pricing about 20% annualized expected volatility for the S&P 500 over the next 30 days. A rough 30-day estimate is 20% divided by √12, or about 5.8%.
14.4 Can beginners trade VIX ETFs?
They can access them through many brokerage accounts, but access does not mean suitability. VIX ETFs and ETNs can be complex, futures-based, and poor long-term holdings. Beginners should be very cautious.
14.5 Why does VIX fall when stocks rise?
When stocks rise calmly, demand for downside protection often declines, reducing option premiums and implied volatility. That can pull VIX lower.
14.6 Should I buy stocks when VIX is high?
A high VIX can coincide with fear-driven selling, but it should not be your only reason to buy. Use valuation, time horizon, diversification, cash needs, and a staged plan.
15. Final thoughts: the honest way to use the fear index
The VIX is one of the most useful market indicators because it turns option-market expectations into a single number. It can help beginners understand whether markets are calm, nervous, or panicked. But the best investors do not worship one indicator. They use it as part of a broader risk-management process.
If you remember only one thing, remember this: VIX tells you how wide the road may be, not which direction the car will drive. Use it to slow down, size positions wisely, avoid emotional trades, and make decisions that fit your financial plan.
Reader Advice
This article is provided solely for general educational and informational purposes. It does not constitute personalized investment, financial, tax, legal, or trading advice, and it should not be treated as a recommendation to buy, sell, or hold any security, option, futures contract, exchange-traded product, or volatility-linked instrument. Market conditions, product structures, regulations, tax rules, index methodologies, fees, and risk characteristics may change over time and may differ by country, broker, investor profile, and other circumstances.
Before making any decision, read the relevant prospectus and official product documents, verify current facts and figures through authoritative sources, and consider your objectives, time horizon, liquidity needs, financial position, and tolerance for loss. Options, leverage, futures, ETNs, and VIX-linked products can be complex and may result in substantial or total loss. Consult an appropriately qualified and regulated financial, tax, or legal professional when advice specific to your circumstances is required.
Sources Consulted and Checked
The following sources were consulted and checked while preparing this document to support accuracy, clarity, and factual reliability.
- Cboe: VIX Volatility Products overview — https://www.cboe.com/tradable-products/vix/
- Cboe: Cboe Volatility Index Methodology, February 2026 — https://cdn.cboe.com/resources/indices/Volatility_Index_Methodology_Cboe_Volatility_Index.pdf
- S&P Dow Jones Indices: VIX introductory guide — https://www.spglobal.com/spdji/en/vix-intro/
- Cboe: VIX FAQs — https://www.cboe.com/tradable-products/vix/faqs/
- Investopedia: Understanding the CBOE Volatility Index (VIX) in Investing — https://www.investopedia.com/terms/v/vix.asp