On-Chain Metrics for Bitcoin: Complete Guide, Examples, Risks and Best Practices
1. Quick Answer: What Are Bitcoin On-Chain Metrics?
Bitcoin on-chain metrics are measurements created from public Bitcoin blockchain data. They help analysts study network activity, miner behavior, transaction demand, investor cost basis, wallet activity, and long-term holder behavior. Examples include transaction count, active addresses, transfer volume, fees, hash rate, difficulty, realized cap, MVRV, SOPR, HODL waves, exchange flows, and supply held by long-term holders.
The most important thing to understand is this: on-chain metrics are research tools, not magic price predictors. They can help you ask better questions, but they should be used with market data, macro context, risk management, and common sense.
2. Why On-Chain Metrics Matter for Bitcoin
Bitcoin is unusually transparent compared with traditional financial systems. Anyone can inspect the blockchain and see confirmed transactions, block times, fees, addresses, and UTXOs. This does not reveal every user’s real-world identity, but it does create a large public dataset for studying the network.
For beginners, on-chain metrics are useful because they help answer practical questions: Is network demand rising? Are fees high because blocks are full? Are miners under pressure? Are many coins being moved after a long time? Is the market trading far above or below the average on-chain cost basis?
3. Simple Diagram: How On-Chain Analysis Works
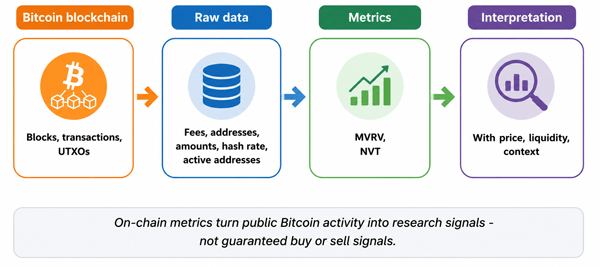
Figure 1: A simple flow from Bitcoin blockchain data to on-chain metrics and interpretation.
4. Bitcoin Basics You Need Before Reading Metrics
4.1 Blocks
Bitcoin transactions are grouped into blocks. A new block is usually added about every 10 minutes on average, although the exact time varies. Metrics based on blocks include block size, block weight, transaction count per block, miner revenue, fees per block, and block interval.
4.2 Transactions
A Bitcoin transaction moves value from one or more inputs to one or more outputs. The transaction pays a fee based mainly on how much block space it uses and current demand for confirmation. When many people want to transact quickly, fee rates can rise.
4.3 UTXOs
Bitcoin uses a UTXO model, which stands for unspent transaction output. Think of UTXOs as individual pieces of bitcoin that can be spent in future transactions. Many advanced metrics, such as realized cap, coin age, and spent output profit ratio, depend on UTXO data.
4.4 Addresses Are Not the Same as Users
One person can create many Bitcoin addresses, and one exchange can control many addresses for millions of customers. This is why metrics like active addresses are useful but imperfect. They are better viewed as activity indicators than exact user counts.
5. Core Categories of Bitcoin On-Chain Metrics
| Category | What it studies | Examples | Beginner use |
|---|---|---|---|
| Network activity | How much the Bitcoin network is being used | Transactions, active addresses, transfer volume | Spot rising or falling usage |
| Fees and mempool | Demand for block space | Median fee, fee rate, mempool size | Estimate transaction urgency and congestion |
| Mining and security | Miner competition and network security | Hash rate, difficulty, miner revenue | Understand mining pressure and security trend |
| Supply and holder behavior | Where coins are and how long they sit | Long-term holder supply, HODL waves, dormant supply | Study accumulation or distribution |
| Valuation-style metrics | Price compared with on-chain cost basis or profit | Realized cap, realized price, MVRV, NUPL | Identify broad cycle conditions, not exact tops/bottoms |
| Exchange and entity flows | Movement to or from known entities | Exchange inflows/outflows, miner flows | Watch potential liquidity changes |
6. Most Useful Bitcoin On-Chain Metrics Explained
6.1 Transaction Count
Transaction count measures how many confirmed Bitcoin transactions occur over a period, often daily. Rising transaction count can show more network use, but it does not always mean more people are using Bitcoin. One user can create many transactions, and batching can reduce transaction count even when economic activity is high.
Example: If transaction count rises while fees also rise, there may be strong demand for limited block space. If transaction count rises but average transfer value is tiny, the activity may be low-value or related to a specific application trend.
6.2 Active Addresses
Active addresses count addresses that send or receive bitcoin during a period. This is often used as a rough proxy for network participation. It is not the same as active users because one user can use many addresses, and custodians can represent many users behind a small number of addresses.
Best use: Compare active addresses with other metrics. A rise in active addresses plus higher transfer volume and higher fees is more meaningful than a rise in active addresses alone.
6.3 Transfer Volume
Transfer volume estimates how much BTC or USD value moved on-chain. It can help show the scale of settlement activity, but raw volume can be misleading because change outputs, internal exchange movements, and self-transfers may inflate activity.
Best practice: Use adjusted transfer volume from reputable data providers when available. Adjusted versions try to remove obvious self-churn and other non-economic movements.
6.4 Transaction Fees and Fee Rates
Fees show how much users are willing to pay to get transactions confirmed. Fee rate is often expressed in satoshis per virtual byte, or sats/vB. Higher fee rates usually mean more competition for block space.
Practical use: Before sending bitcoin, check current fee conditions. If your payment is not urgent, you may choose a lower fee and wait longer. If it is urgent, you may need a higher fee rate.
6.5 Mempool Size
The mempool is the set of valid unconfirmed transactions waiting to be included in blocks. A large or growing mempool can indicate congestion. However, each Bitcoin node has its own mempool, so numbers can differ slightly across tools.
Example: If the mempool is large and high-fee transactions dominate, a low-fee transaction may stay unconfirmed for a long time unless it supports fee bumping methods such as Replace-by-Fee or Child-Pays-for-Parent.
6.6 Hash Rate
Hash rate estimates the amount of computing power securing Bitcoin. Higher hash rate generally means miners are contributing more work, which makes attacks more expensive. Hash rate is estimated from block production and difficulty, so short-term readings can be noisy.
Beginner interpretation: Rising hash rate over months usually suggests strong miner participation. A sudden drop may reflect miners turning off machines, energy disruptions, regulation, or temporary randomness in block discovery.
6.7 Mining Difficulty
Difficulty measures how hard it is to find a valid Bitcoin block. Bitcoin adjusts difficulty every 2,016 blocks so that blocks continue to arrive roughly every 10 minutes on average. When miners add hash power, difficulty tends to rise after adjustment. When miners leave, difficulty tends to fall.
6.8 Miner Revenue
Miner revenue comes from the block subsidy plus transaction fees. After each halving, the subsidy falls, so fees become more important for long-term miner economics. Miner revenue is useful for understanding whether miners may be under stress or highly profitable.
6.9 Realized Cap
Realized capitalization values each coin at the price when it last moved on-chain, rather than at the current market price. It is often used as a rough estimate of the aggregate on-chain cost basis of the Bitcoin supply. This metric is powerful, but it has assumptions: coins can move between a person’s own wallets without representing a real sale, and exchange transfers can complicate interpretation.
6.10 Realized Price
Realized price is realized cap divided by circulating supply. Many analysts treat it as an average on-chain cost basis. When market price is far below realized price, the market may be in a stress period. When market price is far above realized price, unrealized profits may be high. Neither condition guarantees what happens next.
6.11 MVRV Ratio
MVRV stands for Market Value to Realized Value. It compares Bitcoin’s market cap with realized cap. A very high MVRV can suggest that many holders are sitting on large unrealized profits. A low MVRV can suggest stress or undervaluation relative to on-chain cost basis. Use it as a broad cycle tool, not a trading trigger.
6.12 SOPR
SOPR stands for Spent Output Profit Ratio. It compares the price when coins are spent with the price when those coins last moved. If SOPR is above 1, coins moved on-chain are generally being spent in profit. If below 1, they are generally being spent at a loss.
Example: In a strong uptrend, SOPR often stays above 1 because sellers can realize profits while demand absorbs supply. In weak markets, failed attempts to regain SOPR above 1 may show that holders are selling into break-even levels.
6.13 NUPL
NUPL stands for Net Unrealized Profit/Loss. It estimates whether the market is collectively in unrealized profit or loss. It is useful for understanding broad sentiment and cycle position, but it should not be used alone because market structure changes over time.
6.14 HODL Waves and Coin Age
HODL waves group Bitcoin supply by how long coins have remained unmoved. For example, a chart may show the share of supply last moved less than one month ago, one to three months ago, one to two years ago, or more than five years ago. Older coins moving can be notable because long-dormant holders may be taking action.
6.15 Long-Term Holder Supply
Long-term holder supply estimates how much BTC is held by wallets that historically behave like long-term holders. Rising long-term holder supply can suggest accumulation or reduced liquid supply. Falling long-term holder supply can suggest distribution, especially during strong bull markets.
6.16 Exchange Inflows and Outflows
Exchange inflows estimate BTC moving into known exchange wallets. Exchange outflows estimate BTC leaving exchanges. Inflows may signal potential selling pressure, while outflows may suggest self-custody, long-term holding, or movement to other services. These are not guarantees because exchanges move funds internally and entity labeling is imperfect.
6.17 Supply on Exchanges
Supply on exchanges estimates how much BTC is held by known exchange addresses. A long-term decline can suggest more coins are moving to self-custody or long-term storage. A rise can suggest more coins are available for trading. Always check whether the change is broad across exchanges or caused by one platform’s wallet reshuffle.
7. Comparison Table: Beginner-Friendly Meaning of Key Metrics
| Metric | Plain-English meaning | Bullish-looking signal | Risk or limitation |
|---|---|---|---|
| Active addresses | Number of addresses active in a period | Sustained rise with fees and volume | Not equal to real users |
| Fees | Demand for block space | High fees can show strong demand | Can make Bitcoin expensive to use |
| Hash rate | Estimated mining power | Rising long-term trend | Short-term estimates are noisy |
| Difficulty | How hard mining is | Rising difficulty can show competition | Can squeeze inefficient miners |
| Realized price | Average on-chain cost basis proxy | Price reclaiming realized price after bear market | Coins can move without being sold |
| MVRV | Market value vs realized value | Low levels may show stress/undervaluation | High or low can persist for months |
| SOPR | Profit/loss of spent coins | Above 1 in uptrend | Sensitive to coin movement patterns |
| Exchange inflows | BTC moving to exchanges | Falling inflows may reduce sell pressure | Labels and internal transfers can mislead |
8. How to Use Bitcoin On-Chain Metrics Step by Step
- Start with one question. For example: “Is network demand rising?” or “Are holders taking profits?” Do not open 20 charts without a purpose.
- Choose the right metric category. Use fee and mempool data for transaction demand, miner data for security and mining economics, and valuation-style metrics for broad cycle context.
- Check the time frame. Daily readings can be noisy. Weekly and monthly trends are often more useful for beginners.
- Compare at least two related metrics. For example, active addresses plus fees plus adjusted transfer volume gives a better view than active addresses alone.
- Look for context. Ask whether the move could be caused by exchange wallet maintenance, inscriptions or token activity, miner relocation, a halving, regulation, or market panic.
- Avoid turning a metric into an automatic trade. On-chain data can support a thesis, but it should not replace risk management.
9. Practical Examples
9.1 Example 1: High Fees and a Crowded Mempool
Suppose the mempool is full and fee rates are rising. This tells you that users are competing for block space. A beginner might conclude that Bitcoin is “broken” because fees are expensive, but a better interpretation is that demand is temporarily high relative to limited block capacity. If your transaction is not urgent, waiting may be reasonable. If it is urgent, use a wallet that estimates fees well and supports fee bumping.
9.2 Example 2: Price Falls Below Realized Price
If Bitcoin’s market price trades below realized price, many holders may be underwater on an aggregate cost-basis estimate. Historically, such periods have often been associated with bear-market stress. But this does not mean price must immediately recover. Markets can remain stressed for a long time.
9.3 Example 3: Exchange Inflows Spike
A large exchange inflow may suggest that some holders are preparing to sell, use collateral, or rebalance. But it could also be an internal transfer, a custody change, or movement between services. A cautious analyst checks whether inflows are broad-based, whether spot volume rises, and whether price reacts.
9.4 Example 4: Hash Rate Drops After a Difficulty Peak
A short-term hash rate drop does not automatically mean Bitcoin is unsafe. Hash rate is estimated and can vary due to luck in block discovery. But a sustained decline, especially with falling miner revenue and rising energy costs, may show stress among miners.
10. Benefits of Using On-Chain Metrics for Bitcoin
- Transparency: Bitcoin data is public, verifiable, and available to anyone with the right tools.
- Better context: Metrics can help explain whether price moves are supported by network activity, holder behavior, or miner pressure.
- Cycle awareness: Tools like MVRV, realized price, and NUPL can help frame broad market phases.
- Risk detection: Fee spikes, exchange inflows, miner selling, and dormant coin movement can alert analysts to changing conditions.
- Long-term perspective: On-chain data can reduce emotional decision-making by showing structural trends rather than only price candles.
11. Risks and Limitations
11.1 On-Chain Metrics Can Be Misread
A common mistake is treating every exchange inflow as a guaranteed sale or every outflow as long-term accumulation. Bitcoin transactions show movement, not always intent.
11.2 Address Data Is Imperfect
Addresses are not people. A single user can control many addresses, while one custodian can represent millions of users. This makes user-count estimates difficult.
11.3 Entity Labeling Can Be Wrong
Metrics involving exchanges, miners, ETFs, custodians, or whales depend on address labels. Labels can be incomplete, delayed, or wrong. Even good data providers can miss new wallets or misclassify activity.
11.4 Metrics Can Change Meaning Over Time
Bitcoin market structure changes. ETFs, institutional custody, Lightning Network usage, exchange practices, inscriptions, and new wallet behavior can all change how old metrics should be interpreted.
11.5 Public Data Does Not Equal Complete Data
Bitcoin’s base layer is public, but much activity happens off-chain: exchange trading, custodial transfers, Lightning payments, derivatives, OTC desks, and ETF creation/redemption activity. On-chain metrics are only one part of the market picture.
11.6 No Metric Predicts the Future
Even historically useful indicators can fail. Market participants learn, liquidity changes, and macro conditions can dominate on-chain signals. Always use position sizing and risk controls.
12. Common Beginner Mistakes
- Using one metric as a buy or sell signal.
- Ignoring whether the metric is raw, adjusted, entity-adjusted, or smoothed.
- Comparing Bitcoin metrics directly with metrics from another chain without understanding design differences.
- Assuming active addresses equal active users.
- Assuming old coins moving always means a whale is selling.
- Ignoring fees, liquidity, macro news, derivatives, and market structure.
- Looking only at daily charts and overreacting to noise.
13. Best Practices for Reading Bitcoin On-Chain Metrics
| Best practice | Why it matters | Example |
|---|---|---|
| Use multiple metrics | Reduces false signals | Combine exchange flows, spot volume, and price reaction |
| Prefer trends over single days | Daily data is noisy | Use 7-day or 30-day moving averages |
| Know the formula | Prevents misuse | Understand MVRV before calling Bitcoin overvalued |
| Check data source methodology | Providers define metrics differently | Adjusted volume can differ from raw volume |
| Separate movement from intent | Blockchain shows transfers, not motives | Exchange inflow may not equal immediate selling |
| Use risk management | Metrics can be wrong or early | Set invalidation levels and position limits |
14. Recommended Beginner Workflow
Here is a simple workflow for a beginner who wants to study Bitcoin without getting overwhelmed:
- Open a Bitcoin dashboard from a reputable source.
- Check price, realized price, and MVRV for broad valuation context.
- Check transaction fees and mempool data to understand current network demand.
- Check active addresses and adjusted transfer volume for activity trends.
- Check hash rate, difficulty, and miner revenue for mining health.
- Check exchange flows only as supporting evidence, not as a standalone signal.
- Write a short conclusion in plain English: “The network is busy, fees are high, miners look healthy, and holders are in profit,” or “Activity is weak, fees are low, and price is below realized price.”
15. Where to Find Bitcoin On-Chain Metrics
You can find Bitcoin on-chain metrics through block explorers, node software, and analytics platforms. Beginners usually start with dashboards and explorers, while advanced users may run a full node or use APIs.
| Tool type | What it is good for | Examples of use |
|---|---|---|
| Block explorers | Viewing transactions, blocks, fees, addresses | Check if a transaction is confirmed |
| Mempool dashboards | Fee estimates and unconfirmed transaction demand | Decide whether to send now or later |
| Analytics platforms | Advanced metrics and charts | Study MVRV, realized cap, HODL waves |
| Full node data | Independent verification and raw data access | Build custom metrics |
| APIs and datasets | Research, models, dashboards | Pull daily network data into spreadsheets |
16. On-Chain Metrics vs Technical Analysis vs Fundamental Analysis
| Approach | Focus | Strength | Weakness |
|---|---|---|---|
| On-chain analysis | Blockchain activity and holder behavior | Uses transparent network data | Can be misinterpreted and may miss off-chain activity |
| Technical analysis | Price, volume, chart patterns | Useful for timing and market structure | Can ignore network fundamentals |
| Fundamental analysis | Adoption, regulation, macro, security, liquidity | Broad view of value drivers | Hard to quantify and often subjective |
The best research often combines all three. On-chain data can show what is happening on the Bitcoin network, technical analysis can show how the market is trading, and fundamental analysis can explain the larger environment.
17. Beginner Checklist Before Trusting a Metric
- What exactly does this metric measure?
- Is it raw, adjusted, smoothed, or entity-adjusted?
- What assumptions does it make?
- Can one exchange, miner, or large wallet distort the reading?
- Is the signal confirmed by related metrics?
- Does it still make sense in the current market structure?
- What would prove my interpretation wrong?
18. Frequently Asked Questions
18.1 Are Bitcoin on-chain metrics accurate?
They are accurate in the sense that they are based on public blockchain data, but interpretation can be difficult. Metrics that require entity labeling, user estimation, or adjusted volume depend on assumptions and provider methodology.
18.2 Can on-chain metrics predict Bitcoin price?
No metric can reliably predict price. Some metrics have been useful for understanding broad market cycles, but they can be early, late, or wrong. Treat them as evidence, not certainty.
18.3 What is the best Bitcoin on-chain metric for beginners?
A good beginner set includes transaction fees, mempool size, active addresses, adjusted transfer volume, hash rate, realized price, and MVRV. This gives a balanced view of usage, congestion, security, and market cost basis.
18.4 Is high hash rate always bullish?
High hash rate generally suggests strong miner participation and network security, but it does not guarantee price will rise. If miner revenue is weak and difficulty is high, some miners may face pressure despite strong hash rate.
18.5 Do exchange outflows always mean accumulation?
No. Exchange outflows can mean self-custody, institutional custody, internal wallet changes, movement to another platform, or long-term holding. They are useful signals only when confirmed by other data.
18.6 Why do different platforms show different numbers?
Platforms use different definitions, filters, address labels, time zones, smoothing methods, and adjustment techniques. Always read the methodology before comparing numbers.
18.7 Can Bitcoin on-chain metrics identify whales?
They can reveal large address movements, but they do not always identify who controls the coins. A large transaction may be a whale, an exchange, a custodian, a fund, or an internal transfer.
18.8 Should beginners use on-chain metrics for trading?
Beginners should use them mainly for learning and context. Trading based only on on-chain metrics is risky because signals can be delayed, noisy, or misunderstood.
19. Final Thoughts
Bitcoin on-chain metrics are powerful because they turn public blockchain activity into useful research signals. They can help you understand network demand, miner behavior, long-term holder trends, market cost basis, and potential liquidity changes. But they are not perfect, and they are not a shortcut to guaranteed profits.
The safest approach is to use on-chain metrics as part of a broader research process. Start with simple questions, use related metrics together, check methodology, avoid overconfidence, and remember that blockchain data shows what moved - not always why it moved.
Sources Consulted and Checked
These sources were consulted and checked while preparing this document to support clarity and accuracy.
- Bitcoin.org Developer Guide - Transactions: explains Bitcoin transaction fees, inputs, outputs, and transaction structure.
- Bitcoin.org Developer Guide - Block Chain: explains Bitcoin blocks, proof-of-work, mining difficulty, and difficulty adjustment.
- Blockchain.com Charts - Hash Rate and Difficulty: public explanations of mining hash rate and network difficulty.
- Coin Metrics Product Docs - Active Addresses: explains active addresses and limitations when using them as a user proxy.
- Glassnode Research - The Foundational On-chain Metric: The Realized Cap: explains realized cap and related valuation concepts.
- Glassnode Studio - Realized Price and MVRV chart description: describes realized price as an on-chain cost-basis concept and MVRV as a derivative metric.
- Mempool.space - public Bitcoin mempool and block explorer for fees, transactions, blocks, and network conditions.
Reader Advice
This article is provided for educational and informational purposes only. It is not personalized financial, investment, tax, legal, or trading advice, and it should not be treated as a recommendation to buy, sell, hold, or use Bitcoin. On-chain metrics can be incomplete, delayed, provider-dependent, or misinterpreted, and cryptocurrency markets involve significant volatility, loss, security, custody, and regulatory risks. Rules, policies, laws, tax treatment, platform practices, and statistics can change over time and vary by region, so readers should verify current information through official and reliable sources and consider qualified professional advice before making important decisions.