Exchange Inflows and Outflows: Complete Guide, Examples, Risks and Best Practices
Exchange inflows are crypto assets sent into exchange wallets. Exchange outflows are crypto assets withdrawn from exchange wallets. Netflow is usually calculated as inflows minus outflows. A positive netflow means more coins entered exchanges than left during a period, while a negative netflow means more coins left exchanges than entered.
These metrics can help you understand possible selling pressure, accumulation, liquidity changes, custody behavior, whale activity, and market sentiment. They are useful, but they are not trading signals by themselves. A large exchange inflow does not always mean a sell-off is coming, and a large outflow does not always mean bullish accumulation. Context matters.
1. What Are Exchange Inflows and Outflows?
In crypto, an exchange is a platform where users can buy, sell, trade, or custody digital assets. Examples include centralized exchanges, broker platforms, derivatives venues, and sometimes institutional custodial platforms. On-chain analysts track known exchange wallet addresses and measure how much crypto moves into and out of those addresses.
An exchange inflow happens when coins move from an external wallet to an exchange-controlled wallet. An exchange outflow happens when coins move from an exchange-controlled wallet to an external wallet. The external wallet could belong to an individual, a whale, a fund, a miner, another exchange, a custodian, a DeFi protocol, or a service provider.
| Metric | Simple meaning | Common interpretation | Important warning |
|---|---|---|---|
| Exchange inflow | Coins deposited into exchange wallets | May indicate coins are becoming available to trade or sell | Could also be custody movement, market making, collateral transfer, or internal routing |
| Exchange outflow | Coins withdrawn from exchange wallets | May indicate self-custody, accumulation, treasury movement, or reduced exchange supply | Could also be a transfer to another exchange, custodian, OTC desk, or operational wallet |
| Exchange netflow | Inflows minus outflows | Positive netflow = more coins entered exchanges; negative netflow = more coins left | Netflow needs price, volume, derivatives, stablecoin, and news context |
| Exchange reserve | Total coins held in tracked exchange wallets | Rising reserves may suggest more available exchange supply; falling reserves may suggest coins leaving exchanges | Labels are estimates and may miss wallets or include operational reshuffling |
2. Why Exchange Flows Matter
Exchange flows matter because exchanges are major places where crypto is converted, traded, leveraged, deposited as collateral, or withdrawn into self-custody. When large amounts of an asset move toward exchanges, traders often ask whether holders are preparing to sell. When large amounts move away from exchanges, traders often ask whether buyers are moving coins into long-term storage.
The core idea is simple: coins cannot usually be sold on a centralized exchange until they arrive there. Likewise, coins leaving an exchange are often less immediately available for spot selling on that venue. This is why exchange flows are treated as a market structure indicator rather than a guarantee of future price direction.
2.1 Common Reasons for Exchange Inflows
- A holder wants to sell or take profit.
- A trader wants to move coins to an exchange for active trading.
- A market maker is adding inventory to provide liquidity.
- A user is transferring collateral for margin, futures, or options trading.
- A miner, company, or fund is rebalancing treasury assets.
- A custodian, broker, or exchange is moving assets for operational reasons.
- A hacked wallet or scammer is trying to cash out, which requires extra caution and compliance context.
2.2 Common Reasons for Exchange Outflows
- A buyer wants to hold coins in self-custody.
- An institution or whale is moving assets to cold storage.
- A user is withdrawing after buying on an exchange.
- A fund is moving assets to a custodian or another trading venue.
- A trader is sending coins to DeFi, staking, lending, or bridging.
- An exchange is reorganizing wallets or moving assets between hot and cold wallets.
- Users are withdrawing funds because they are worried about exchange risk.
3. How Exchange Flow Tracking Works
Exchange flow tracking depends on wallet labeling. Blockchain transactions are public on most major chains, but wallet ownership is not always directly visible. Analytics providers identify exchange clusters by using known deposit addresses, withdrawal patterns, user reports, public disclosures, heuristics, tagging methods, and transaction behavior. They then calculate flows between exchange clusters and non-exchange wallets.
Because wallet labeling is probabilistic, exchange flow data should be treated as a high-quality estimate, not perfect truth. Different providers may show different numbers because they use different address clusters, chain coverage, filters, and methods for handling internal transfers.
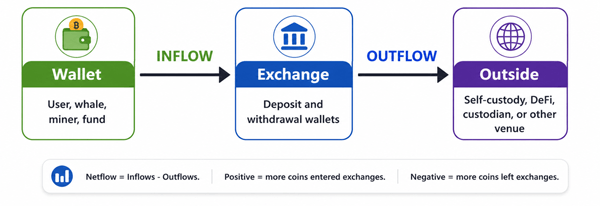
Diagram: Basic exchange inflow, outflow, and netflow logic.
3.1 The Basic Formula
Netflow = Exchange Inflows - Exchange Outflows
| Example | Inflows | Outflows | Netflow | Plain-English reading |
|---|---|---|---|---|
| Day 1 | 10,000 BTC | 6,000 BTC | +4,000 BTC | More BTC entered exchanges than left. This may increase available exchange supply. |
| Day 2 | 5,000 BTC | 12,000 BTC | -7,000 BTC | More BTC left exchanges than entered. This may suggest withdrawals, accumulation, custody shifts, or reduced exchange supply. |
| Day 3 | 8,000 BTC | 8,200 BTC | -200 BTC | Near balanced. The signal may be weak unless other data confirms it. |
4. Inflows vs Outflows vs Netflow vs Exchange Reserves
Beginners often mix these terms together. They are related, but they do not measure the same thing. Inflows and outflows measure movement during a period. Netflow measures the difference during that period. Exchange reserve measures the total amount held by tracked exchange wallets at a point in time.
| Question | Best metric to check | Why it helps |
|---|---|---|
| Are coins moving toward exchanges today? | Exchange inflow | Shows deposits into exchange wallets during the selected period. |
| Are coins leaving exchanges today? | Exchange outflow | Shows withdrawals from exchange wallets during the selected period. |
| Is the net direction toward or away from exchanges? | Exchange netflow | Combines inflows and outflows into one directional number. |
| Are exchange balances rising or falling over time? | Exchange reserve | Shows the total tracked balance held by exchanges. |
| Are whales making unusually large deposits? | Inflow mean, inflow by size, large transaction filters | Helps separate many small deposits from a few very large ones. |
5. How to Read Exchange Inflows and Outflows Step by Step
Step 1: Choose the Asset and Chain
Start with one asset, such as Bitcoin, Ether, USDT, USDC, or a major altcoin. Be careful with multi-chain assets. A stablecoin may exist on Ethereum, Tron, Solana, BNB Chain, and other networks. Looking at only one chain can give an incomplete view.
Step 2: Choose the Timeframe
Short timeframes can be noisy. A one-hour spike may be a single operational transfer. A seven-day or thirty-day trend can be more useful for beginners because it filters out some noise. For trading analysis, compare the short-term spike with the longer-term average.
| Timeframe | Best for | Weakness |
|---|---|---|
| Hourly | Spotting sudden deposits, whale transfers, exchange stress, event reactions | Very noisy and easy to misread |
| Daily | Reading market behavior around news, price moves, liquidations, or big transfers | Still affected by internal transfers and one-off events |
| 7-day moving average | Smoother trend reading | Can react slowly to sudden changes |
| 30-day or longer | Macro supply and custody trends | May hide important short-term stress |
Step 3: Compare Flow Size With Normal Activity
A 5,000 BTC inflow may be huge on one day and less meaningful on another if overall market volume is unusually high. Always compare a spike with recent averages, spot volume, derivatives activity, and price movement.
Step 4: Check Whether It Is a Single Large Transfer or Many Smaller Transfers
One large transfer can create a dramatic chart spike. That may be a whale, a custodian, an exchange wallet reorganization, a fund movement, or a mislabeled transfer. Many smaller deposits from different wallets may show broader market behavior. This difference matters.
Step 5: Look at Price Reaction
If large inflows arrive while price is falling and spot volume is rising, selling pressure may be increasing. If large inflows arrive but price holds strongly, buyers may be absorbing supply. If outflows increase while price rises, it may suggest accumulation, but it can also reflect buyers withdrawing after purchases.
Step 6: Confirm With Other Indicators
Never rely on exchange flows alone. Confirm with market depth, order book liquidity, funding rates, open interest, stablecoin supply, realized profit or loss, miner flows, whale wallet behavior, news, and broader risk sentiment.
6. Practical Examples
6.1 Example 1: Large Bitcoin Inflow During a Price Rally
Imagine Bitcoin rises quickly from $95,000 to $102,000 and exchange inflows jump above the 30-day average. A beginner might immediately assume a crash is coming. A better interpretation is: some holders may be preparing to sell, take profit, trade, or post collateral. The next question is whether price rejects, spot selling increases, and order books show heavy sell pressure.
Best response: do not panic. Watch whether the inflow is followed by actual selling volume, a break of support, or widening volatility. A deposit is only a potential supply event; it is not proof that the depositor sold.
6.2 Example 2: Negative Netflow After a Long Accumulation Period
Suppose Ether shows negative exchange netflow for several weeks while exchange reserves trend lower. This may suggest buyers are withdrawing ETH into self-custody, staking, institutional custody, or long-term storage. That can be constructive if demand remains strong, but it does not guarantee price will rise. Macro news, leverage, regulation, and liquidity can still dominate.
6.3 Example 3: Stablecoin Inflows to Exchanges
Stablecoin flows can mean something different from Bitcoin or Ether flows. When stablecoins flow into exchanges, traders may be preparing to buy crypto, provide liquidity, trade pairs, or move funds between platforms. When stablecoins flow out, users may be withdrawing cash-like assets, moving to DeFi, or reducing exchange exposure.
6.4 Example 4: Exchange Outflows During an Exchange Confidence Crisis
A sudden rise in outflows from one exchange can reflect users moving funds to self-custody because they are worried about that platform. In that case, outflows are not simply bullish accumulation. They may be a risk signal about exchange trust, solvency concerns, or user behavior after negative news.
7. Benefits of Using Exchange Flow Data
- It gives a real-time or near-real-time view of on-chain movement.
- It helps identify unusual deposits and withdrawals.
- It can reveal changing exchange supply conditions.
- It helps compare whale behavior with retail behavior when size filters are available.
- It improves market context when combined with price, volume, and derivatives data.
- It can help risk managers monitor exchange concentration and custody movement.
8. Limitations and Risks
Exchange flow data is useful, but it is easy to misuse. The biggest mistake is treating every inflow as bearish and every outflow as bullish. Real markets are more complicated.
| Risk or limitation | Why it matters | How to reduce the risk |
|---|---|---|
| Wallet labels may be incomplete | Providers may miss new exchange addresses or misclassify services | Compare multiple data providers and avoid overconfidence |
| Internal transfers can look meaningful | Exchanges often move coins between hot and cold wallets | Check whether movement is between known exchange wallets |
| Inter-exchange transfers can distort signals | Coins may move from one trading venue to another rather than to a final buyer or seller | Look at exchange-specific flows and destination labels |
| Deposits are not the same as sales | A user can deposit coins and not sell them | Confirm with spot volume, order books, and price action |
| Withdrawals are not always accumulation | Coins may go to another venue, DeFi, lending, or custody | Check address type and broader market context |
| Short-term data is noisy | One whale transfer can distort a chart | Use moving averages and compare with historical baselines |
| Stablecoin flows have different meaning | Stablecoins may represent buying power, settlement, or treasury movement | Analyze stablecoins separately from volatile crypto assets |
9. Best Practices for Beginners
- Start with simple metrics: inflow, outflow, netflow, and exchange reserve.
- Use longer timeframes first, such as seven-day and thirty-day trends, before analyzing hourly charts.
- Compare current flows with historical averages instead of reacting to one number.
- Separate Bitcoin, Ether, altcoins, and stablecoins because each behaves differently.
- Look at exchange-specific data when possible, especially during exchange-related news.
- Check whether a spike is caused by one huge transfer or many smaller transfers.
- Combine flows with price, volume, liquidity, funding rates, open interest, and news.
- Treat flow data as evidence, not a prediction engine.
- Use reputable analytics platforms and understand their methodology notes.
- Keep a written thesis before acting: what did you observe, what would confirm it, and what would prove it wrong?
10. Common Mistakes and Misconceptions
10.1 Mistake 1: “Large Inflow Means Price Will Crash”
A large inflow can increase potential sell-side supply, but it does not prove selling happened. The depositor may be transferring collateral, preparing a trade, market making, moving to another platform, or using custody services. Watch the follow-through.
10.2 Mistake 2: “Large Outflow Means Whales Are Accumulating”
A large outflow may show accumulation, but it may also be an exchange wallet movement, inter-exchange transfer, custodian transfer, staking deposit, DeFi movement, or user withdrawal during platform stress.
10.3 Mistake 3: Ignoring Stablecoin Flows
Stablecoin inflows can show potential buying power arriving on exchanges, while stablecoin outflows can show funds leaving trading venues. But stablecoin flows are also used for settlement, arbitrage, treasury movement, and cross-border liquidity. They should be interpreted separately.
10.4 Mistake 4: Using One Provider Without Checking Methodology
Different analytics platforms may report different exchange balances and flows. This does not always mean one is wrong. It can happen because of different wallet clusters, chain coverage, time intervals, and internal-transfer filters.
11. Exchange Flow Checklist
Before making any decision based on exchange inflows and outflows, run through this checklist:
- Which asset and chain am I analyzing?
- Is the flow unusual compared with the 7-day and 30-day average?
- Is it one large transfer or many deposits/withdrawals?
- Which exchange or exchanges are involved?
- Is there related news, liquidation activity, regulatory action, or exchange-specific concern?
- Does price action confirm or reject the flow signal?
- What do spot volume, market depth, funding rates, and open interest show?
- Could this be an internal transfer, custodian movement, or inter-exchange move?
- What would prove my interpretation wrong?
12. Tools You Can Use to Track Exchange Inflows and Outflows
Beginners can track exchange flows through on-chain analytics platforms, blockchain explorers, and market data dashboards. The best tool depends on whether you want a simple chart, exchange-specific data, address-level investigation, or professional risk monitoring.
| Tool type | Examples | Best use case | Beginner note |
|---|---|---|---|
| On-chain analytics dashboards | CryptoQuant, Glassnode, Coin Metrics | Charts for inflows, outflows, netflow, reserves, and moving averages | Best starting point for structured metrics |
| Blockchain explorers | Etherscan, BTC explorers, Solscan, Tronscan | Checking individual transactions and wallet movements | Requires more manual interpretation |
| Market data platforms | CoinMarketCap, TradingView integrations, exchange dashboards | Combining flows with price and volume | Useful for context, but methodology can vary |
| Compliance and forensic tools | Chainalysis and similar providers | Investigations, risk scoring, illicit finance monitoring | Usually professional or institutional use |
13. Pros and Cons of Exchange Flow Analysis
| Pros | Cons |
|---|---|
| Shows real on-chain movement rather than only price candles | Wallet labeling is imperfect and varies by provider |
| Can identify unusual deposits, withdrawals, and exchange reserve changes | Large transfers can be operational rather than market directional |
| Useful for whale tracking, risk monitoring, and market context | Does not show intent; deposits do not prove selling |
| Works well with other on-chain and market metrics | Short-term signals can be noisy and misleading |
| Helps beginners understand supply movement around exchanges | Can encourage overtrading if treated as a standalone signal |
14. How Traders, Long-Term Investors, and Risk Managers Use It
14.1 For Traders
Traders may use exchange flows to monitor possible supply pressure, buying power, exchange-specific stress, or whale activity. The safest approach is to treat flows as a context layer, then wait for confirmation from price action, volume, liquidity, and derivatives data.
14.2 For Long-Term Investors
Long-term investors may watch exchange reserves and multi-week netflow trends. Falling reserves over long periods can suggest more coins are moving away from exchanges, but it should be interpreted alongside adoption, macro conditions, holder profitability, and market cycles.
14.3 For Risk Managers
Risk managers may monitor sudden exchange outflows, concentration of reserves, proof-of-reserve data, large deposits from risky addresses, and platform-specific stress. In this context, exchange flows are not just market signals; they are operational and counterparty risk indicators.
15. Beginner-Friendly Interpretation Matrix
| Observed pattern | Possible meaning | What to check next |
|---|---|---|
| High BTC inflows + falling price | Possible selling pressure or risk-off behavior | Spot sell volume, support levels, whale deposits, derivatives liquidations |
| High BTC inflows + rising price | Supply may be absorbed by strong demand | Order books, spot volume, ETF or institutional flows, market news |
| High BTC outflows + rising price | Possible accumulation or withdrawals after buying | Destination wallets, exchange reserve trend, long-term holder behavior |
| High BTC outflows + exchange-specific negative news | Users may be reducing platform risk | Proof-of-reserve data, exchange statements, withdrawal delays, social/news context |
| High stablecoin inflows | Potential buying power or liquidity entering exchanges | Stablecoin pairs, spot volume, risk appetite, market depth |
| High stablecoin outflows | Funds leaving exchanges or moving to DeFi/custody | DeFi deposits, chain activity, exchange-specific situation |
16. FAQs
16.1 Are exchange inflows bearish?
They can be bearish, but not always. Inflows mean coins entered exchange wallets, which may increase potential selling supply. However, deposits can also be for trading, collateral, custody, market making, or internal operations.
16.2 Are exchange outflows bullish?
They can be bullish when they reflect buyers withdrawing coins into long-term storage, but outflows can also be transfers to custodians, other exchanges, DeFi protocols, staking, or operational wallets. Always confirm with other data.
16.3 What is exchange netflow?
Exchange netflow is inflows minus outflows. Positive netflow means more coins entered exchanges than left. Negative netflow means more coins left exchanges than entered.
16.4 What is exchange reserve?
Exchange reserve is the total amount of a crypto asset held in tracked exchange wallets at a given time. It is often used to study whether exchange-held supply is rising or falling.
16.5 Can exchange flows predict price?
No metric can reliably predict price by itself. Exchange flows can show possible supply and demand behavior, but price is affected by liquidity, leverage, news, macro conditions, regulation, market makers, and investor psychology.
16.6 Why do different websites show different exchange flow numbers?
They may use different wallet labels, exchange clusters, time intervals, internal-transfer filters, chain coverage, and calculation methods. Use methodology notes and compare providers when the decision matters.
16.7 Do exchange flows work for all cryptocurrencies?
They are most useful for liquid assets with good exchange labeling and active on-chain movement. For small tokens, bridged tokens, privacy-focused assets, or assets with poor labeling coverage, the data may be less reliable.
16.8 What is the safest way for a beginner to use exchange flows?
Use them as a context tool, not a buy or sell button. Start with long-term trends, compare flow spikes with historical averages, confirm with market data, and avoid making decisions from one chart.
17. Final Takeaway
Exchange inflows and outflows are among the most useful beginner-friendly on-chain metrics because they show how crypto assets move toward and away from trading venues. Inflows can suggest potential selling supply or active trading preparation. Outflows can suggest self-custody, accumulation, custody movement, or reduced exchange exposure. Netflow and exchange reserves help summarize these movements over time.
The best way to use exchange flow data is with humility. It tells you what moved, not always why it moved. Good analysis combines flows with price, volume, liquidity, derivatives, stablecoins, wallet behavior, and real-world news. Used carefully, exchange inflows and outflows can improve your understanding of crypto markets. Used carelessly, they can lead to false confidence and poor decisions.
Sources Consulted and Checked
These sources were consulted and checked while preparing this document to support its accuracy and clarity.
- CryptoQuant User Guide: Exchange In/Outflow and Netflow, updated March 5, 2026.
- CryptoQuant: Exchange Reserve documentation.
- Glassnode Insights: Bitcoin On-Chain Exchange Metrics: The Good, The Bad, and The Ugly.
- Glassnode: Proof-of-Reserve Exchange Metrics.
- Coin Metrics: Exchange flow metrics overview.
- Chainalysis: Analyzing Cryptocurrency Market Events with On-Chain Data.
- CoinMarketCap: Crypto Exchanges Asset Inflows and Outflows.
Reader Advice
This article is provided for educational and informational purposes only. It is not personalized financial, investment, trading, legal, tax, compliance, or risk-management advice, and it should not be treated as a recommendation to buy, sell, hold, transfer, or custody any crypto asset. Crypto markets, exchanges, wallets, and on-chain data involve significant risks, including price volatility, loss of funds, platform or counterparty failure, cyber incidents, inaccurate wallet labels, and misinterpretation of data. Rules, policies, laws, market conditions, and statistics can change over time and may vary by country or region, so please verify important information through current official sources and consider advice from an appropriately qualified professional before making a decision.